- Seaborn 教程
- Seaborn - 首页
- Seaborn - 简介
- Seaborn - 环境设置
- 导入数据集和库
- Seaborn - 图形美学
- Seaborn - 调色板
- Seaborn - 直方图
- Seaborn - 核密度估计
- 可视化成对关系
- Seaborn - 绘制分类数据
- 观测值的分布
- Seaborn - 统计估计
- Seaborn - 绘制宽格式数据
- 多面板分类图
- Seaborn - 线性关系
- Seaborn - Facet Grid
- Seaborn - Pair Grid
- 函数参考
- Seaborn - 函数参考
- Seaborn 有用资源
- Seaborn - 快速指南
- Seaborn - 有用资源
- Seaborn - 讨论
Seaborn.cubehelix_palette() 方法
Seaborn.cubehelix_palette() 方法用于从 cubehelix 系统创建顺序调色板。
此方法还可以生成具有线性变化(增加或减少)亮度的颜色映射。这意味着,无论何时将颜色信息打印为黑白,或者由色盲者查看时,信息都会自动保留。用户可以通过不同的默认设置在 matplotlib 中获得对 cubehelix_palette() 函数的更多控制。
我们可以使用现有的 cubehelix 调色板,也可以使用 seaborn 库生成一个。
语法
以下是 cubehelix_palette() 方法的语法:
seaborn.cubehelix_palette(n_colors=6, start=0, rot=0.4, gamma=1.0, hue=0.8, light=0.85, dark=0.15, reverse=False, as_cmap=False)
参数
下面描述了 cubehelix 方法的参数。
| 序号 | 参数和描述 |
|---|---|
| 1 | n_colors 循环中的颜色数量。 |
| 2 | start 螺旋开始处的色调。此值介于 0 和 3 之间。 |
| 3 | rot 接受浮点值,它是调色板范围内围绕色调轮的旋转次数。 |
| 4 | hue 接受浮点值,介于 0 和 1 之间。它是颜色的饱和度。 |
| 5 | gamma 接受浮点值,它强调较暗或较亮的色彩。 |
| 6 | dark 接受浮点值,调色板中最暗颜色的强度。 |
| 7 | light 接受浮点值,设置调色板中最亮颜色的强度。 |
| 8 | reverse 接受布尔值,如果为真,则调色板颜色将从暗到亮。 |
| 9 | as_cmap() 接受布尔值并返回一个 matplotlib 颜色映射。 |
返回值
此方法返回 RGB 元组列表或 matplotlib 颜色映射。
示例 1
在此示例中,我们将了解 cubehelix 方法的工作原理。我们不会向其传递任何参数,并将显示默认调色板。
import seaborn as sns
import matplotlib.pyplot as plt
titanic=sns.load_dataset("titanic")
titanic.head()
sns.palplot(sns.cubehelix_palette())
plt.show()
输出
输出如下所示:
示例 2
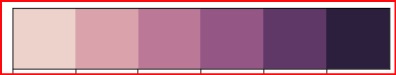
在此示例中,我们将 rot 值传递给 cubehelix_palette() 方法。rot 参数接受浮点值,它是调色板范围内围绕色调轮的旋转次数。
import seaborn as sns
import matplotlib.pyplot as plt
titanic=sns.load_dataset("titanic")
titanic.head()
sns.palplot(sns.cubehelix_palette(rot=0.7))
plt.show()
输出
获得的输出是一个 matplotlib 颜色映射,可以在下面看到。
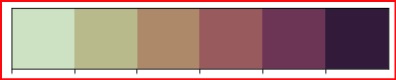
rot 参数也可以接受负值。在下面的示例中,我们将看到当传递给 rot 的值为负数时会生成不同的调色板。
import seaborn as sns
import matplotlib.pyplot as plt
titanic=sns.load_dataset("titanic")
titanic.head()
sns.palplot(sns.cubehelix_palette(rot=-0.2))
plt.show()
输出
产生的输出如下所示:

示例 3
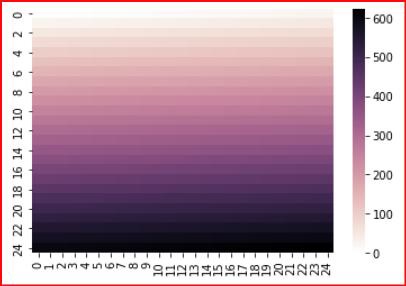
在这里,我们将了解如何使用此方法创建的自定义调色板生成颜色映射。要生成热图,我们需要使用 heatmap 函数,为此,可以使用以下代码行。这里,light 设置为 1,表示调色板中最亮颜色的强度。由于 as_cmap 传递了 True 值,因此会生成一个颜色映射,并将其存储在 cmap 中。此 cmap 以及存储在 x 变量中的范围传递给 heatmap,并生成以下热图。
import seaborn as sns
import matplotlib.pyplot as plt
titanic=sns.load_dataset("titanic")
titanic.head()
from numpy import arange
x = arange(625).reshape(25, 25)
cmap = sns.cubehelix_palette(dark=0, light=1, as_cmap=True)
ax = sns.heatmap(x, cmap=cmap)
plt.show()
输出
上述代码行的输出如下所示: