- Seaborn 教程
- Seaborn - 首页
- Seaborn - 简介
- Seaborn - 环境设置
- 导入数据集和库
- Seaborn - 图表美学
- Seaborn - 颜色调色板
- Seaborn - 直方图
- Seaborn - 核密度估计
- 可视化成对关系
- Seaborn - 绘制分类数据
- 观测值的分布
- Seaborn - 统计估计
- Seaborn - 绘制宽格式数据
- 多面板分类图
- Seaborn - 线性关系
- Seaborn - FacetGrid
- Seaborn - PairGrid
- 函数参考
- Seaborn - 函数参考
- Seaborn 有用资源
- Seaborn - 快速指南
- Seaborn - 有用资源
- Seaborn - 讨论
Seaborn.hls_palette() 方法
Seaborn.hls_palette() 方法用于获取一组均匀分布在HSL颜色空间中的颜色。
HSL系统包含用色相、饱和度和亮度测量的图像。色相代表图像的颜色,饱和度是颜色中纯净度的量,亮度是色相的强度。
这些色相通常均匀地分布在圆形路径上。因此,生成的调色板将代表分类和循环数据。h、s和l的值必须始终在0和1之间。
语法
以下是hls_palette()方法的语法:
seaborn.hls_palette(n_colors=6, h=0.01, l=0.6, s=0.65, as_cmap=False)
参数
HLS调色板方法的参数描述如下。
| 序号 | 参数和描述 |
|---|---|
| 1 | n_colors 循环中的颜色数量。 |
| 2 | h 接受浮点数,是颜色循环的第一个色相。 |
| 3 | s 接受浮点值,是颜色的饱和度。 |
| 4 | l 接受浮点值,是颜色的亮度。 |
返回值
它返回一个matplotlib颜色图的RGB元组列表。
示例1
在这个例子中,我们将了解hls_palette()方法的工作原理。此方法基本上允许用户通过更改颜色的色相、亮度和饱和度来创建自定义调色板。
为了绘制自定义创建的调色板,使用palplot()方法。这个seaborn.palplot()方法使用户能够绘制自定义调色板并查看特定调色板中包含的潘通色。color_palette和palplto()方法的区别在于,color_palette()方法绘制matplotlib调色板的颜色,而palplot()方法用于绘制自定义调色板。
import seaborn as sns
import matplotlib.pyplot as plt
titanic=sns.load_dataset("titanic")
titanic.head()
sns.palplot(sns.hls_palette(15))
plt.show()
输出
获得的输出如下:

示例2
在这个例子中,我们将色相值与n_colors值一起传递给hls_paletee()方法。这里,色相值设置为0.4,这是自定义颜色系列中第一个色相的值。
import seaborn as sns
import matplotlib.pyplot as plt
titanic=sns.load_dataset("titanic")
titanic.head()
sns.palplot(sns.hls_palette(15,h=0.4))
plt.show()
输出
获得的输出是以下颜色序列:

示例3
在这里,我们将饱和度值与n-colors值一起传递给该方法。在本例中,饱和度设置为0.2。
import seaborn as sns
import matplotlib.pyplot as plt
titanic=sns.load_dataset("titanic")
titanic.head()
#sns.palplot(sns.hls_palette(16, s=.2))
plt.show()
输出
产生的输出如下:

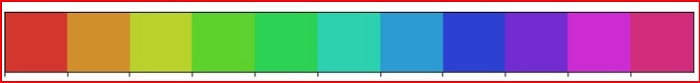
示例4
在这里,我们将亮度值与n_colors值一起传递给该方法。在本例中,亮度设置为0.5。
import seaborn as sns
import matplotlib.pyplot as plt
titanic=sns.load_dataset("titanic")
titanic.head()
sns.palplot(sns.hls_palette(11, l=.5))
plt.show()
输出
产生的输出如下:
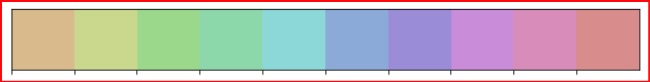
示例5
在这里,我们将所有参数传递给hls_palette()方法,然后绘制颜色。
import seaborn as sns
import matplotlib.pyplot as plt
titanic=sns.load_dataset("titanic")
titanic.head()
sns.palplot(sns.hls_palette(10, l=.7,s=.5,h=0.1))
plt.show()
输出
产生的输出如下: