- Seaborn 教程
- Seaborn - 首页
- Seaborn - 简介
- Seaborn - 环境设置
- 导入数据集和库
- Seaborn - 图表美学
- Seaborn - 调色板
- Seaborn - 直方图
- Seaborn - 核密度估计
- 可视化成对关系
- Seaborn - 绘制分类数据
- 观测值的分布
- Seaborn - 统计估计
- Seaborn - 绘制宽格式数据
- 多面板分类图
- Seaborn - 线性关系
- Seaborn - FacetGrid
- Seaborn - PairGrid
- 函数参考
- Seaborn - 函数参考
- Seaborn 有用资源
- Seaborn - 快速指南
- Seaborn - 有用资源
- Seaborn - 讨论
Seaborn.move_legend() 方法
图表或绘图中的图例是页面的一部分,或者图表的一部分,它有助于解释/理解图表。Seaborn.move_legend() 方法用于将图表的图例重新创建到新的位置。
您无法访问 Matplotlib 图例的位置参数,因此,尽管名称表明此方法移动图例,但它实际上是复制图例的信息,在新的位置重新创建它并删除旧的图例。
语法
以下是 seaborn.move_legend() 方法的语法:
seaborn.move_legend(obj, loc, **kwargs)
参数
下面描述了 move_legend() 方法的参数。
| 序号 | 名称和描述 |
|---|---|
| 1 | Obj 这是与绘图关联的对象。 |
| 2 | Loc 此参数接受字符串或整数,它是位置参数。 |
| 3 | Kwargs 可以传递其他参数。 |
loc 参数接受诸如“右中”、“左中”、“右上”、“左上”、“左下”、“右下”、“右”、“下中”、“上中”和“中”等值。可以传递的其他 kwargs 是 matplotlib 图例方法的一部分。
要了解如何使用它,我们需要绘制图表,为此,我们必须从库中导入内置数据集。
在继续绘制图表之前,让我们加载 seaborn 库和数据集。
加载 seaborn 库
要加载或导入 seaborn 库,可以使用以下代码行。
Import seaborn as sns
加载数据集
在本文中,我们将使用 seaborn 库中内置的泰坦尼克号数据集。使用以下命令加载数据集。
titanic=sns.load_dataset("titanic")
以下命令用于查看数据集中前 5 行。这使我们能够了解可以使用哪些变量来绘制图表。
titanic.head()
以下是上述代码的输出。
index,survived,pclass,sex,age,sibsp,parch,fare,embarked,class,who,adult_male,deck,embark_town,alive,alone
0,0,3,male,22.0,1,0,7.25,S,Third,man,true,NaN,Southampton,no,false
1,1,1,female,38.0,1,0,71.2833,C,First,woman,false,C,Cherbourg,yes,false
2,1,3,female,26.0,0,0,7.925,S,Third,woman,false,NaN,Southampton,yes,true
现在我们已经加载了数据集,我们将探索一些示例。
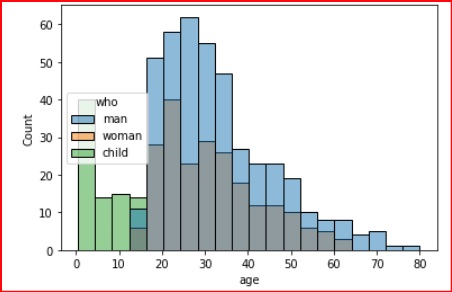
示例 1
在这个例子中,我们将了解如何使用 move_legend() 方法来更改图例的位置。在这个例子中,我们将一个位置传递给 loc 参数,然后观察图例在显示的图表中如何变化。
import seaborn as sns
import matplotlib.pyplot as plt
titanic=sns.load_dataset("titanic")
titanic.head()
ax = sns.histplot(titanic, x="age", hue="who")
sns.move_legend(ax, "center left")
plt.show()
输出
产生的输出如下:
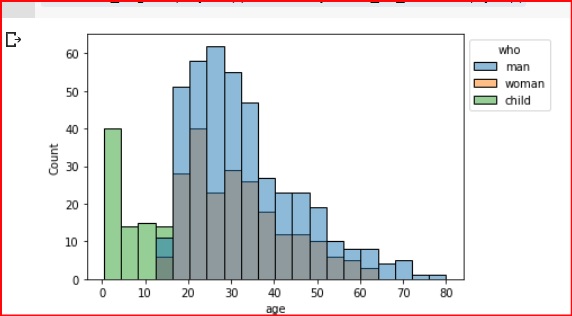
示例 2
在这个例子中,我们将图例移到图表的左上角。由于 bbox_to_anchor 设置为 (1,1),图例被移到了绘图边界之外。此参数用于精细控制,例如将图例移出框外。
import seaborn as sns
import matplotlib.pyplot as plt
titanic=sns.load_dataset("titanic")
titanic.head()
ax = sns.histplot(titanic, x="age", hue="who")
sns.move_legend(ax, "upper left", bbox_to_anchor=(1, 1))
plt.show()
输出
产生的输出如下:
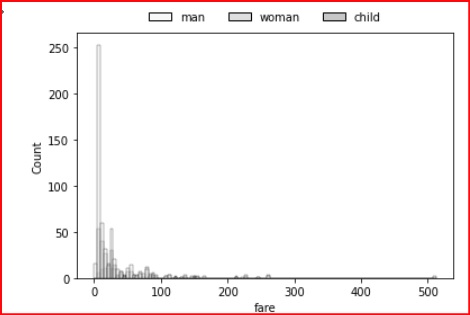
示例 3
在这个例子中,我们将向图例添加一些属性以更改其外观。可以使用以下代码行来获得下图所示的图例。
import seaborn as sns
import matplotlib.pyplot as plt
titanic=sns.load_dataset("titanic")
titanic.head()
ax = sns.histplot(titanic, x="age", hue="who")
sns.move_legend(ax, "lower center", bbox_to_anchor=(.5, 1), ncol=3, title=None, frameon=False)
plt.show()
输出
上述代码的输出,其中图例的属性略微更改以使其看起来更具风格,如下所示。