- Seaborn 教程
- Seaborn - 首页
- Seaborn - 简介
- Seaborn - 环境设置
- 导入数据集和库
- Seaborn - 图形美观
- Seaborn - 调色板
- Seaborn - 直方图
- Seaborn - 核密度估计
- 可视化成对关系
- Seaborn - 绘制分类数据
- 观测值的分布
- Seaborn - 统计估计
- Seaborn - 绘制宽格式数据
- 多面板分类图
- Seaborn - 线性关系
- Seaborn - Facet Grid
- Seaborn - Pair Grid
- 函数参考
- Seaborn - 函数参考
- Seaborn 有用资源
- Seaborn - 快速指南
- Seaborn - 有用资源
- Seaborn - 讨论
Seaborn.set_palette() 方法
Seaborn.set_palette() 方法用于设置绘图的调色板。此方法的一个用途是为稍后可视化的绘图设置调色板。使用 seaborn 调色板,此方法设置 matplotlib 颜色循环。
语法
以下是 seaborn.set_palette() 方法的语法:
seaborn.set_palette(palette, n_colors=None, desat=None, color_codes=False)
参数
seaborn.set_palette() 方法的参数如下所述。
| 序号 | 参数和描述 |
|---|---|
| 1 | 调色板 (Palette) 要设置的调色板。 |
| 2 | 颜色数量 (n_colors) 循环中的颜色数量。 |
| 3 | 去饱和度 (Desat) 每个颜色去饱和的比例。 |
| 4 | 颜色代码 (Color_codes) 接受布尔值,如果传递 True,则将简写颜色代码(例如“b”、“g”、“r”等)重新映射到此调色板中的颜色。 |
加载 seaborn 库
在继续开发绘图之前,让我们加载 seaborn 库和数据集。要加载或导入 seaborn 库,可以使用以下代码行。
Import seaborn as sns
加载数据集
在本文中,我们将使用 seaborn 库中内置的泰坦尼克号数据集。以下命令用于加载数据集。
titanic=sns.load_dataset("titanic")
以下命令用于查看数据集中前 5 行。这使我们能够了解可以使用哪些变量来绘制图形。
titanic.head()
以下是上述代码段的输出。
index,survived,pclass,sex,age,sibsp,parch,fare,embarked,class,who,adult_male,deck,embark_town,alive,alone
0,0,3,male,22.0,1,0,7.25,S,Third,man,true,NaN,Southampton,no,false
1,1,1,female,38.0,1,0,71.2833,C,First,woman,false,C,Cherbourg,yes,false
2,1,3,female,26.0,0,0,7.925,S,Third,woman,false,NaN,Southampton,yes,true
现在我们已经加载了数据集,我们将探索一些示例。
如上所述,set_palette 方法用于设置以下绘图的颜色调色板,它接受不同的值,其中一些值为:
{'Accent', 'Accent_r', 'Blues', 'Blues_r', 'BrBG', 'BrBG_r', 'BuGn', 'BuGn_r', 'BuPu', 'BuPu_r', 'CMRmap', 'CMRmap_r', 'Dark2', 'Dark2_r', 'GnBu', 'GnBu_r', 'Greens', 'Greens_r', 'Greys', 'Greys_r', 'OrRd', 'OrRd_r', 'Oranges', 'Oranges_r', 'PRGn', 'PRGn_r', 'Paired', 'Paired_r', 'Pastel1', 'Pastel1_r', 'Pastel2', 'Pastel2_r', 'PiYG'}
以下示例描述了 seaborn.set_palette() 方法的用法。
示例 1
在下面的示例中,我们将 icefire 作为颜色调色板传递给 set_palette() 方法并绘制图形以查看颜色调色板。
import seaborn as sns
import matplotlib.pyplot as plt
titanic=sns.load_dataset("titanic")
titanic.head()
sns.set_palette("icefire")
plt.show()
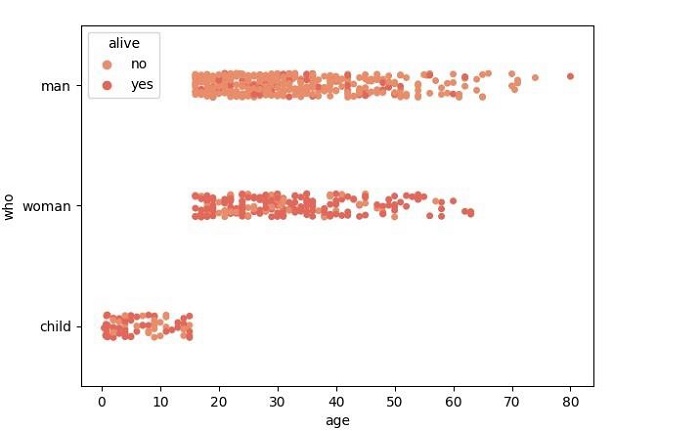
接下来,我们将绘制一个图形来查看设置的颜色调色板。在此示例中,我们将使用 stripplot() 方法并使用 seaborn 库中内置的泰坦尼克号数据集。
import seaborn as sns
import matplotlib.pyplot as plt
titanic=sns.load_dataset("titanic")
titanic.head()
sns.stripplot(x="age", y="who", hue="alive",data=titanic,jitter=0.5,linewidth=1)
plt.show()
输出
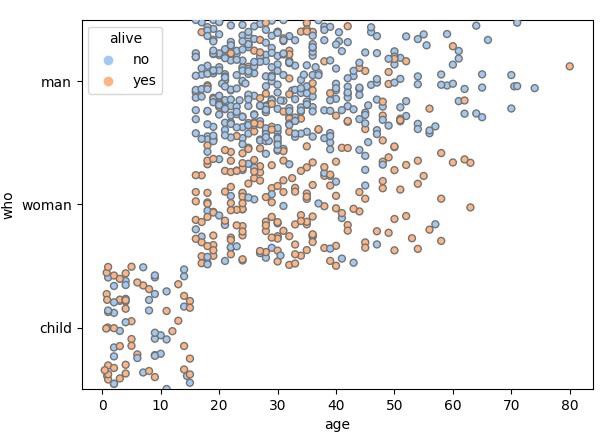
示例 2
在此示例中,我们将了解 set 中另一个颜色调色板的工作原理。
import seaborn as sns
import matplotlib.pyplot as plt
titanic=sns.load_dataset("titanic")
titanic.head()
sns.set_palette("pastel")
sns.stripplot(x="age", y="who", hue="alive",data=titanic,jitter=0.5,linewidth=1)
plt.show()
上述代码包含以下颜色调色板,用于传递的调色板名称。

输出
上述示例的输出如下:
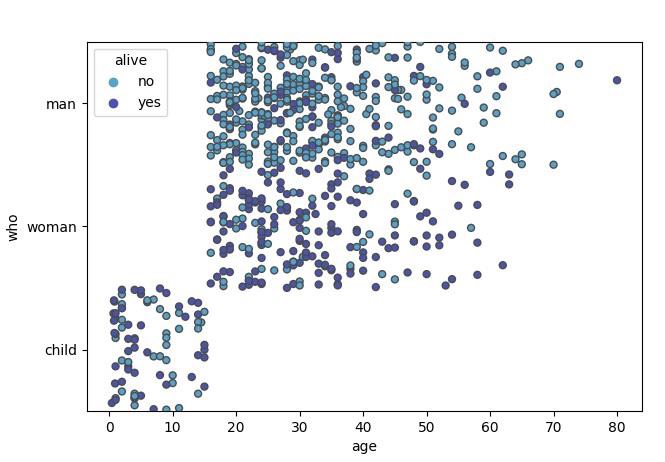
示例 3
在此示例中,我们将通过简单地将其作为参数传递给 set_palette() 方法来查看另一个 matplotlib 调色板。
import seaborn as sns
import matplotlib.pyplot as plt
titanic=sns.load_dataset("titanic")
titanic.head()
sns.set_palette("flare")
plt.show()
上述代码行将包含以下颜色序列,这些颜色是调色板的一部分,稍后生成的绘图将包含类似的颜色。

假设使用以下代码生成绘图,则将获得如下所示的绘图,并且如观察到的那样,它包含与上述 pantone 中显示的颜色相同的颜色。
import seaborn as sns
import matplotlib.pyplot as plt
titanic=sns.load_dataset("titanic")
titanic.head()
sns.stripplot(x="age", y="who", hue="alive",data=titanic)
plt.show()
输出
生成的输出图如下所示: