- Seaborn 教程
- Seaborn - 首页
- Seaborn - 简介
- Seaborn - 环境设置
- 导入数据集和库
- Seaborn - 图形美观
- Seaborn - 调色板
- Seaborn - 直方图
- Seaborn - 核密度估计
- 可视化成对关系
- Seaborn - 绘制分类数据
- 观测值的分布
- Seaborn - 统计估计
- Seaborn - 绘制宽格式数据
- 多面板分类图
- Seaborn - 线性关系
- Seaborn - Facet Grid
- Seaborn - Pair Grid
- 函数参考
- Seaborn - 函数参考
- Seaborn 有用资源
- Seaborn - 快速指南
- Seaborn - 有用资源
- Seaborn - 讨论
Seaborn.stripplot() 方法
seaborn.stripplot() 方法用于绘制散点图,其中作为参数传递的变量之一是分类变量。此图可以单独绘制,但通常也用于补充其他图,例如箱线图,其中除了描绘所有观测值之外,还需要显示一些潜在的分布。
此方法采用不同的格式作为输入,例如数组、长格式数据、宽格式数据或向量列表。
语法
以下是 seaborn.stripplot() 方法的语法
seaborn.stripplot(*, x=None, y=None, hue=None, data=None, order=None, hue_order=None, jitter=True, dodge=False, orient=None, color=None, palette=None, size=5, edgecolor='gray', linewidth=0, ax=None, **kwargs
参数
此方法的一些参数如下所示:
| 序号 | 名称和描述 |
|---|---|
| 1 | x,y 这些参数将变量名称作为输入,以绘制长格式数据。 |
| 2 | data 这是用于绘制图形的数据框。 |
| 3 | hue 数据框中需要用于绘制图形的变量名称。 |
| 4 | jitter 此参数采用浮点值,并根据此值对分类变量的数据进行间隔。它仅适用于分类数据。 |
| 5 | linewidth 此参数采用浮点值,并确定构成图中元素的灰色线条的宽度。 |
| 6 | dodge 此参数采用布尔值。如果我们使用色调嵌套,则将 true 传递给此参数将分离不同色调级别的条带。如果传递 False,则每个级别的点将彼此叠加绘制。 |
| 7 | orient 它采用“h”或“v”值,并根据此确定图形的方向。 |
| 8 | color matplotlib 颜色作为输入,这决定了所有元素的颜色。 |
在继续开发绘图之前,让我们加载 seaborn 库和数据集。
加载 seaborn 库
要加载或导入 seaborn 库,可以使用以下代码行。
Import seaborn as sns
加载数据集
在本文中,我们将使用 seaborn 库中内置的泰坦尼克号数据集。以下命令用于加载数据集。
titanic=sns.load_dataset("titanic")
以下命令用于查看数据集中前 5 行。这使我们能够了解哪些变量可用于绘制图形。
titanic.head()
以下是上述代码段的输出。
index,survived,pclass,sex,age,sibsp,parch,fare,embarked,class,who,adult_male,deck,embark_town,alive,alone
0,0,3,male,22.0,1,0,7.25,S,Third,man,true,NaN,Southampton,no,false
1,1,1,female,38.0,1,0,71.2833,C,First,woman,false,C,Cherbourg,yes,false
2,1,3,female,26.0,0,0,7.925,S,Third,woman,false,NaN,Southampton,yes,true
现在我们已经加载了数据集,我们将探索一些示例。
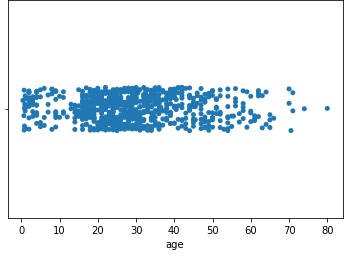
示例 1
我们将了解一个简单的快捷方式,可用于绘制 stripplot()。与其将数据和 x 作为单独的参数传递,不如将它们组合并作为单个参数在 x 参数中传递。可以使用以下代码行来实现。
import seaborn as sns
import matplotlib.pyplot as plt
titanic=sns.load_dataset("titanic")
titanic.head()
sns.stripplot(x=titanic["age"])
plt.show()
输出
上述代码行产生的输出如下所示:
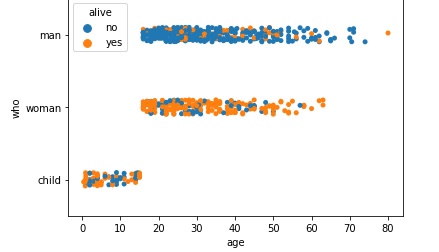
示例 2
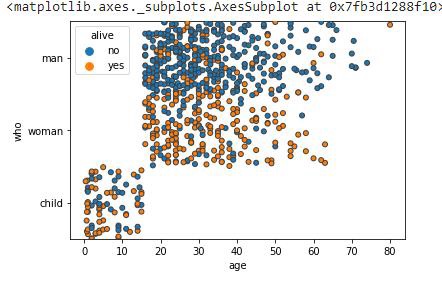
现在,我们将连同 x、y 参数一起传递 hue 参数,并查看获得的图表的更改。由于我们使用的是泰坦尼克号数据集,因此我们将 alive 变量传递给 hue,并将 age 和 sex 分别传递给 x 和 dy 参数。可以使用以下代码行生成所需的绘图。
import seaborn as sns
import matplotlib.pyplot as plt
titanic=sns.load_dataset("titanic")
titanic.head()
sns.stripplot(x="age", y="who", hue="alive",data=titanic)
plt.show()
输出
生成的绘图如下所示。
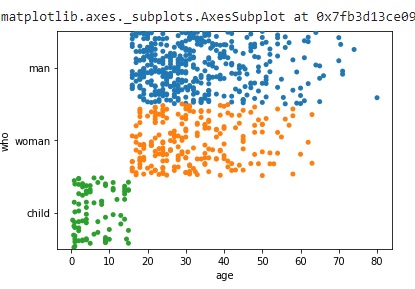
示例 3
seaborn.stripplot() 方法中有很多参数,我们将了解另一个名为 jitter 的参数的工作原理。jitter 参数用于对分类变量的数据进行间隔,它仅适用于分类类型的数据。它采用浮点值作为输入。
以下代码片段描述了它的用法,生成的绘图也可以在下面查看。
import seaborn as sns
import matplotlib.pyplot as plt
titanic=sns.load_dataset("titanic")
titanic.head()
#jitter spaces out categorical data and works only on this type of data.
sns.stripplot(x="age", y="who", data=titanic,jitter=0.5)
plt.show()
输出
示例 4
seaborn.stripplot() 方法中有很多参数,我们将了解另一个名为 jitter 和 linewidth 的参数的工作原理。jitter 参数用于对分类变量的数据进行间隔,它仅适用于分类类型的数据。它采用浮点值作为输入。linewidth 参数采用浮点值,并确定构成图中元素的灰色线条的宽度。
以下代码片段描述了它的用法,生成的绘图也可以在下面查看。
import seaborn as sns
import matplotlib.pyplot as plt
titanic=sns.load_dataset("titanic")
titanic.head()
sns.stripplot(x="age", y="who", hue="alive",data=titanic,jitter=0.5,linewidth=1)
plt.show()
输出
生成的输出图如下所示。
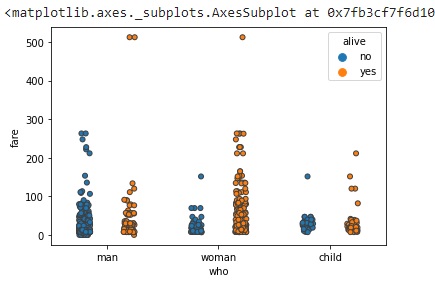
示例 5
在这个示例中,我们将了解如何将 dodge 参数与上面使用的参数一起使用。此参数采用布尔值。如果我们使用色调嵌套,则将 true 传递给此参数将分离不同色调级别的条带。如果传递 False,则每个级别的点将彼此叠加绘制。以下代码行可用于使用 dodge 参数绘制图形。
import seaborn as sns
import matplotlib.pyplot as plt
titanic=sns.load_dataset("titanic")
titanic.head()
sns.stripplot(y="fare", x="who", hue="alive",data=titanic,linewidth=1,dodge=True)
plt.show()
输出
获得的输出如下所示: