
 数据结构
数据结构 网络
网络 关系数据库管理系统 (RDBMS)
 操作系统
操作系统 Java
Java iOS
iOS HTML
HTML CSS
CSS Android
 Python
 C语言编程
C语言编程 C++
C++ C#
C# MongoDB
 MySQL
MySQL Javascript
 PHP
PHP如何在Python Plotly中将多个图表添加到Plotly Dash应用程序的单个浏览器页面上?
Plotly 是一个 Python 中的开源绘图库,可以生成多种不同类型的图表。Python 用户可以使用 Plotly 创建交互式的基于 Web 的可视化效果,这些可视化效果可以显示在 Jupyter Notebook 中,保存到独立的 HTML 文件中,或者作为使用 Dash 的 Web 应用程序的一部分进行服务。Plotly 也可以用于静态文档发布和桌面编辑器,例如 PyCharm 和 Spyder。
Dash 是一个 Python 框架,用于创建交互式的基于 Web 的仪表板应用程序。Dash 库为基于 Web 的仪表板应用程序添加了所有必需的库。
在本教程中,我们将演示如何在单个浏览器页面上将多个图表添加到 Plotly Dash 应用程序。请按照以下步骤在单个页面上生成多个 Dash 应用程序。
步骤 1
导入 Dash 库。
import dash
步骤 2
导入 Dash 核心组件,**dcc** 和 **html**。
from dash import dcc,html
步骤 3
导入以下 Dash 依赖项。
from dash.dependencies import Input, Output
步骤 4
导入 **plotly.express** 模块并将其别名为 **px**。
import plotly.express as px
步骤 5
使用 Pandas 模块生成数据集
import pandas as pd
df_bar = pd.DataFrame({
   "Season": ["Summer", "Winter", "Autumn", "Spring"],
   "Rating": [3,2,1,4]
})
步骤 6
使用以下值生成条形图,并将其存储在“fig”变量中。
fig = px.bar(df_bar, x="Season", y="Rating", barmode="group")
步骤 7
创建 **main** 函数,使用以下命令运行 App 服务器:
app = dash.Dash(__name__)
if __name__ == '__main__':
   app.run_server(debug=True)
步骤 8
为两个不同的 HTML 子元素在两个“div”部分中生成 App 布局。
app.layout = html.Div(children=[
# elements from the top of the page
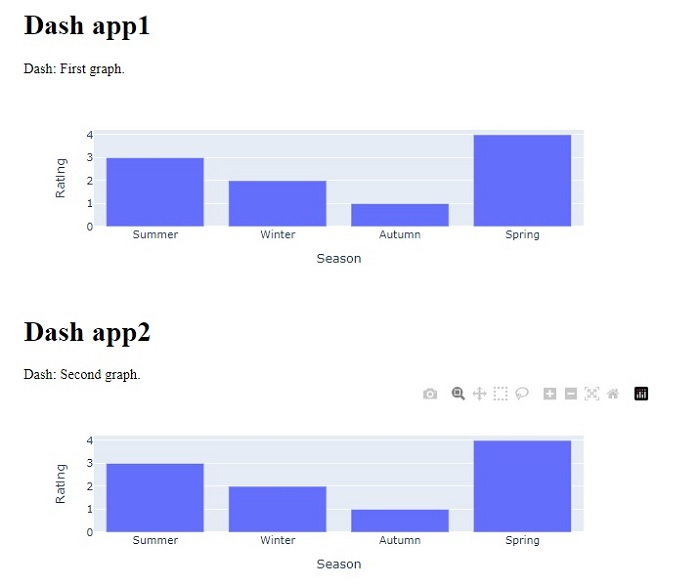
html.Div([html.H1(children='Dash app1'),
html.Div(children='''Dash: First graph.'''),
dcc.Graph(id='graph1',figure=fig),]),
# New Div for all elements in the new 'row' of the page
html.Div([
html.H1(children='Dash app2'),
html.Div(children='''Dash: Second graph.'''),
dcc.Graph(id='graph2',figure=fig),
]),
])
示例
以下是用于在 Dash 中的单个网页上创建多个图表的完整代码:
import dash
from dash import dcc,html
from dash.dependencies import Input, Output

import pandas as pd
import plotly.express as px
app = dash.Dash(__name__)
df_bar = pd.DataFrame({
   "Season": ["Summer", "Winter", "Autumn", "Spring"],
   "Rating": [3,2,1,4]
})

fig = px.bar(df_bar, x="Season", y="Rating", barmode="group")
app.layout = html.Div(children=[
   # elements from the top of the page
   html.Div([
      html.H1(children='Dash app1'),
      html.Div(children='''
      Dash: First graph.'''),

      dcc.Graph(
         id='graph1',
         figure=fig
      ),
   ]),
   # New Div for all elements in the new 'row' of the page
   html.Div([
      html.H1(children='Dash app2'),
      html.Div(children='''
      Dash: Second graph. '''),

      dcc.Graph(
         id='graph2',
         figure=fig
      ),
   ]),
])

if __name__ == '__main__':
app.run_server(debug=True)
输出
执行上述程序后,您将在控制台中获得以下输出:
Dash is running on http://127.0.0.1:8050/
* Serving Flask app 'main'
* Debug mode: on
单击 URL 后,您将被重定向到浏览器,该浏览器将显示以下输出:

更新于:2022年10月21日
5000+ 浏览量

广告