- Seaborn 教程
- Seaborn - 首页
- Seaborn - 简介
- Seaborn - 环境搭建
- 导入数据集和库
- Seaborn - 图表美学
- Seaborn - 调色板
- Seaborn - 直方图
- Seaborn - 核密度估计
- 可视化成对关系
- Seaborn - 绘制分类数据
- 观测值的分布
- Seaborn - 统计估计
- Seaborn - 绘制宽格式数据
- 多面板分类图
- Seaborn - 线性关系
- Seaborn - Facet Grid
- Seaborn - Pair Grid
- 函数参考
- Seaborn - 函数参考
- Seaborn 有用资源
- Seaborn - 快速指南
- Seaborn - 有用资源
- Seaborn - 讨论
Seaborn.axes_style() 方法
Seaborn.axes_style() 方法用于获取控制图表整体外观的设置。
这是通过使样式参数控制各种属性来实现的,例如背景颜色以及是否默认启用网格,这是使用 matplotlib rcParams 系统执行的。
axes_style() 方法也可用于临时更改全局默认值。
语法
以下是 seaborn.axes_styles() 方法的语法:
seaborn.axes_style(style=None, rc=None)
参数
以下是此方法的参数列表:
| 序号 | 参数及描述 |
|---|---|
| 1 | 样式 取值:None、dict 或 {darkgrid, whitegrid, dark, white, ticks} 之一,并确定参数字典或预配置样式的名称。 |
| 2 | Rc 取值为 rcdict,是一个可选参数,用于执行参数映射以覆盖预设 seaborn 样式字典中的值。这只会更新被认为是样式定义一部分的参数。 |
现在我们将通过示例来理解这个方法。
示例 1
首先,只需调用该函数即可生成所有样式参数的当前默认值的列表。正如我们在输出中看到的,生成所有默认值的列表。
import seaborn as sns
import matplotlib.pyplot as plt
tips=sns.load_dataset("tips")
tips.head()
sns.axes_style()
plt.show()
输出
获得的输出为:
{'axes.axisbelow': True, 'axes.edgecolor': '.15', 'axes.facecolor': 'white', 'axes.grid': False, 'axes.labelcolor': '.15', 'axes.spines.bottom': True, 'axes.spines.left': True, 'axes.spines.right': True, 'axes.spines.top': True, 'figure.facecolor': 'white', 'font.family': ['sans-serif'], 'font.sans-serif': ['Arial', 'DejaVu Sans', 'Liberation Sans', 'Bitstream Vera Sans', 'sans-serif'], 'grid.color': '.8', 'grid.linestyle': '-', 'image.cmap': 'rocket', 'lines.solid_capstyle': 'round', 'patch.edgecolor': 'w', 'patch.force_edgecolor': True, 'text.color': '.15', 'xtick.bottom': True, 'xtick.color': '.15', 'xtick.direction': 'out', 'xtick.top': False, 'ytick.color': '.15', 'ytick.direction': 'out', 'ytick.left': True, 'ytick.right': False}
示例 2
接下来,我们尝试通过调用预定义样式的名称来显示该样式的默认值。
在这种情况下,我们将调用白色样式并查看其值。
import seaborn as sns
import matplotlib.pyplot as plt
tips=sns.load_dataset("tips")
tips.head()
sns.axes_style("white")
plt.show()
输出
获得的输出为:
{'axes.axisbelow': True, 'axes.edgecolor': '.15', 'axes.facecolor': 'white', 'axes.grid': False, 'axes.labelcolor': '.15', 'axes.spines.bottom': True, 'axes.spines.left': True, 'axes.spines.right': True, 'axes.spines.top': True, 'figure.facecolor': 'white', 'font.family': ['sans-serif'], 'font.sans-serif': ['Arial', 'DejaVu Sans', 'Liberation Sans', 'Bitstream Vera Sans', 'sans-serif'], 'grid.color': '.8', 'grid.linestyle': '-', 'image.cmap': 'rocket', 'lines.solid_capstyle': 'round', 'patch.edgecolor': 'w', 'patch.force_edgecolor': True, 'text.color': '.15', 'xtick.bottom': False, 'xtick.color': '.15', 'xtick.direction': 'out', 'xtick.top': False, 'ytick.color': '.15', 'ytick.direction': 'out', 'ytick.left': False, 'ytick.right': False}
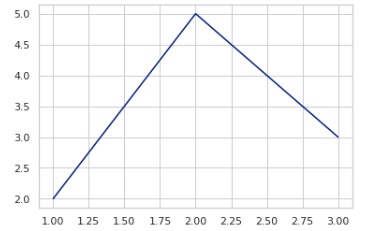
示例 3
现在,我们将尝试通过设置 axes_styles 绘制图表。在下面的示例中绘制了一条线图。
import seaborn as sns
import matplotlib.pyplot as plt
tips=sns.load_dataset("tips")
tips.head()
with sns.axes_style("whitegrid"):
sns.lineplot(x=[1, 2, 3], y=[2, 5, 3])
plt.show()
输出
获得的输出如下:
seaborn_themeing_introduction.htm
广告