- Seaborn 教程
- Seaborn - 首页
- Seaborn - 简介
- Seaborn - 环境设置
- 导入数据集和库
- Seaborn - 图表美学
- Seaborn - 调色板
- Seaborn - 直方图
- Seaborn - 核密度估计
- 可视化成对关系
- Seaborn - 绘制分类数据
- 观测值的分布
- Seaborn - 统计估计
- Seaborn - 绘制宽格式数据
- 多面板分类图
- Seaborn - 线性关系
- Seaborn - Facet Grid
- Seaborn - Pair Grid
- 函数参考
- Seaborn - 函数参考
- Seaborn 有用资源
- Seaborn - 快速指南
- Seaborn - 有用资源
- Seaborn - 讨论
Seaborn.set_color_codes() 方法
Seaborn.set_color_codes() 方法用于更改 matplotlib 颜色缩写 的解释方式。调用此方法将改变 matplotlib 在后续绘图中对诸如“b”或“g”之类的缩写代码的解释方式。
Matplotlib 颜色缩写不过是用于表示颜色的快捷方式。例如,单字符缩写用于表示基本颜色,例如蓝色('b')、绿色('g')、红色('r')、黄色('y')等。
语法
以下是 seaborn.set_color_codes() 方法的语法:
seaborn.set_color_codes(palette='deep')
参数
此方法只有一个参数,解释如下。
| 序号 | 参数及描述 |
|---|---|
| 1 | palette 取值范围为 {deep, muted, pastel, dark, bright, colorblind},用于指定用作颜色来源的 seaborn 调色板名称。 |
在我们进入示例之前,我们将了解如何从 seaborn 库加载数据集。
加载 seaborn 库
要加载或导入 seaborn 库,可以使用以下代码行。
Import seaborn as sns
加载数据集
在本文中,我们将使用 seaborn 库中内置的 Tips 数据集。使用以下命令加载数据集。
tips=sns.load_dataset("tips")
以下命令用于查看数据集中前 5 行。这使我们能够了解可以使用哪些变量来绘制图表。
tips.head()
以下是上述代码的输出。
index,total_bill,tip,sex,smoker,day,time,size
0,16.99,1.01,Female,No,Sun,Dinner,2
1,10.34,1.66,Male,No,Sun,Dinner,3
2,21.01,3.5,Male,No,Sun,Dinner,3
3,23.68,3.31,Male,No,Sun,Dinner,2
4,24.59,3.61,Female,No,Sun,Dinner,4
现在我们已经加载了数据,我们将在接下来的示例中了解该方法的工作原理。
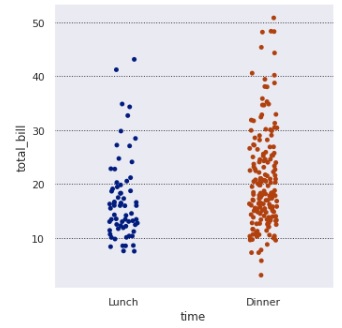
示例 1
在这个示例中,我们将了解如何使用 seaborn 的 set_color_codes() 方法并向其传递参数。稍后我们将绘制图表以使用设置的颜色代码。我们在本例中使用 tips 数据集,并在设置颜色代码后绘制分类图。
import seaborn as sns
import matplotlib.pyplot as plt
tips=sns.load_dataset("tips")
tips.head()
sns.set_color_codes("dark")
sns.catplot(data=tips,x="time",y="total_bill")
plt.show()
输出
生成的输出如下所示:
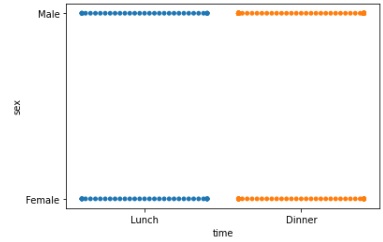
示例 2
我们将向 set_color_codes() 方法传递另一个值,并查看图表是如何变化的。这里,“dark”作为参数传递,之后绘制图表以查看图表颜色代码是如何变化的。
import seaborn as sns
import matplotlib.pyplot as plt
tips=sns.load_dataset("tips")
tips.head()
sns.set_color_codes("dark")
sns.swarmplot(data=tips,x="time",y="sex")
plt.show()
输出
获得的输出如下:
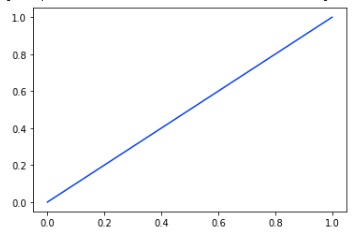
示例 3
我们使用 matplotlib pyplot 方法而不是 seaborn 方法绘制图表并传递数据集。通过这种方式,我们可以理解 seaborn 方法适用于所有类型的图表,而不仅仅是 seaborn 图表。在本例中,颜色代码设置为 bright,下面附上获得的图表。
import seaborn as sns
import matplotlib.pyplot as plt
tips=sns.load_dataset("tips")
tips.head()
sns.set_color_codes("bright")
plt.plot([0, 1], color="b")
plt.show()
输出
输出如下:
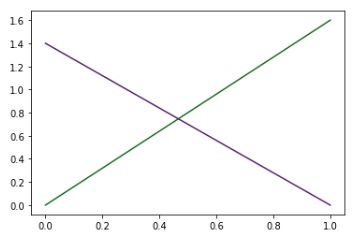
示例 4
在本例中,我们将颜色代码设置为 dark,然后使用 matplotlib pyplot 方法绘制图表并将颜色设置为绿色和紫色。为此要传递给 color 参数的变量是 g(绿色)和 m(紫色)。
import seaborn as sns
import matplotlib.pyplot as plt
tips=sns.load_dataset("tips")
tips.head()
sns.set_color_codes("dark")
_ = plt.plot([0, 1.6], color="g")
_ = plt.plot([1.4, 0], color="m")
plt.show()
输出
获得的图表如下: