- Seaborn 教程
- Seaborn - 首页
- Seaborn - 简介
- Seaborn - 环境搭建
- 导入数据集和库
- Seaborn - 图形美学
- Seaborn - 调色板
- Seaborn - 直方图
- Seaborn - 核密度估计
- 可视化成对关系
- Seaborn - 绘制分类数据
- 观测值的分布
- Seaborn - 统计估计
- Seaborn - 绘制宽格式数据
- 多面板分类图
- Seaborn - 线性关系
- Seaborn - Facet Grid
- Seaborn - Pair Grid
- 函数参考
- Seaborn - 函数参考
- Seaborn 有用资源
- Seaborn - 快速指南
- Seaborn - 有用资源
- Seaborn - 讨论
Seaborn.set_theme 方法
Seaborn.set_theme() 方法用于设置控制绘图整体样式的参数。换句话说,此方法从视觉上设置了 matplotlib 和 seaborn 绘图的所有方面。
此函数执行的主题设置分为各种参数值集,同时使用 matplotlib rcParams 系统更改所有绘图的默认值。
语法
以下是 set_theme() 方法的语法:
seaborn.set_theme(context='notebook', style='darkgrid', palette='deep', font='sans-serif', font_scale=1, color_codes=True, rc=None)
参数
下面将讨论此方法的参数。
| 序号 | 方法和描述 |
|---|---|
| 1 | 上下文 接收字符串或字典作为输入并缩放参数。 |
| 2 | 样式 接收字符串或字典作为输入并确定轴样式参数 |
| 3 | 调色板 接收字符串或序列作为输入并确定颜色调色板 |
| 4 | 字体 接收字符串作为输入并设置绘图的字体系列。 |
| 5 | 字体大小 接收浮点值作为输入并将缩放因子分开以独立缩放字体元素的大小。 |
| 6 | 颜色代码 接收布尔值,如果为真且调色板为 seaborn 调色板,则将简写颜色代码重新映射到此调色板中的颜色。 |
| 7 | rc 接收字典作为输入并接收值以覆盖上述值。 |
加载 seaborn 库
在继续开发绘图之前,让我们加载 seaborn 库和数据集。要加载或导入 seaborn 库,可以使用以下代码行。
Import seaborn as sns
加载数据集
在本文中,我们将使用 seaborn 库中内置的 Tips 数据集。以下命令用于加载数据集。
tips=sns.load_dataset("tips")
以下命令用于查看数据集中的前 5 行。这使我们能够了解可以使用哪些变量来绘制图形。
tips.head()
以下是上述代码段的输出。
index,total_bill,tip,sex,smoker,day,time,size
0,16.99,1.01,Female,No,Sun,Dinner,2
1,10.34,1.66,Male,No,Sun,Dinner,3
2,21.01,3.5,Male,No,Sun,Dinner,3
3,23.68,3.31,Male,No,Sun,Dinner,2
4,24.59,3.61,Female,No,Sun,Dinner,4
现在我们已经加载了数据,我们将继续了解以下示例中该方法的工作原理。
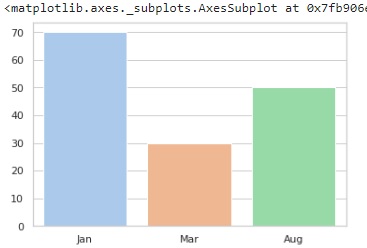
示例 1
我们在下面的代码中设置主题,然后绘制条形图以查看更改是否已反映。在下面的代码中,主题的样式设置为“whitegrid”,调色板为 pastel,这意味着获得的绘图将包含柔和的颜色。稍后初始化条形图以查看绘图,条形图的 x 和 y 参数是包含一些要绘制的值的列表。
import seaborn as sns
import matplotlib.pyplot as plt
tips=sns.load_dataset("tips")
tips.head()
sns.set_theme(style="whitegrid", palette="pastel")
sns.barplot(x=["Jan", "Mar", "Aug"], y=[70, 30, 50])
plt.show()
输出
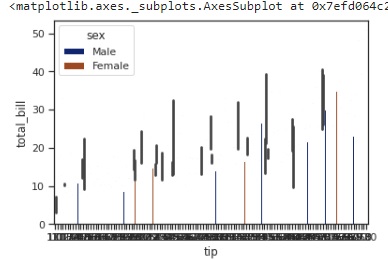
示例 2
在本例中,我们将使用 tips 数据集进行绘图,而不是像在前面的示例中那样进行初始化。我们将 tips 数据集和列 tip、total_bill 和 sex 传递给要绘制的 barplot 方法,并将样式设置为 ticks,在这种情况下,调色板选择为 dark
import seaborn as sns
import matplotlib.pyplot as plt
tips=sns.load_dataset("tips")
tips.head()
sns.set_theme(style="ticks", palette="dark")
sns.barplot(data=tips,x="tip" ,y="total_bill",hue="sex")
plt.show()
输出
获得的输出图如下:
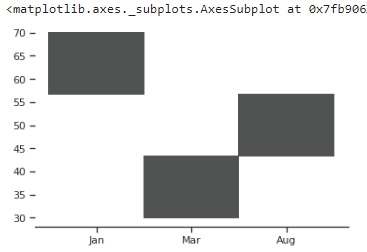
示例 3
在本例中,设置自定义参数并将这些参数传递给 set_theme() 方法,然后绘制图形以查看对主题所做的更改。
自定义参数在具有键值对的字典中初始化,如下所示。
import seaborn as sns
import matplotlib.pyplot as plt
tips=sns.load_dataset("tips")
tips.head()
custom_params = {"axes.spines.right": False, "axes.spines.top": False,"axes.spines.left":False}
sns.set_theme(style="ticks", palette="light:#5A9",rc=custom_params,color_codes=True)
sns.histplot(x=["Jan", "Mar", "Aug"], y=[70, 30, 50])
plt.show()
输出
获得的绘图如下: