- ggplot2 教程
- ggplot2 - 主页
- ggplot2 - 简介
- ggplot2 - 安装 R
- ggplot2 - R 中的默认绘图
- ggplot2 - 操作坐标轴
- ggplot2 - 操作图例
- ggplot2 - 散点图和抖动图
- ggplot2 - 条形图和直方图
- ggplot2 - 饼图
- ggplot2 - 边缘图
- ggplot2 - 气泡图和计数图
- ggplot2 - 发散图
- ggplot2 - 主题
- ggplot2 - 多面板绘图
- ggplot2 - 多个绘图
- ggplot2 - 背景颜色
- ggplot2 - 时间序列
- ggplot2 实用资源
- ggplot2 - 快速指南
- ggplot2 - 实用资源
- ggplot2 - 讨论
ggplot2 - 主题
在本章中,我们将重点介绍使用自定义主题,该主题用于更改工作区的观感。我们将使用“ggthemes”包来理解 R 工作区中的主题管理概念。
让我们执行以下步骤,在提到的数据集中使用所需的主题。
GGTHEMES
在 R 工作区中使用所需的包安装“ggthemes”包。
> install.packages("ggthemes")
> Library(ggthemes)

实施新主题来生成制造商图例及其生产年份和排量。
> library(ggthemes)
> ggplot(mpg, aes(year, displ, color=factor(manufacturer)))+
+ geom_point()+ggtitle("This plot looks a lot different from the default")+
+ theme_economist()+scale_colour_economist()
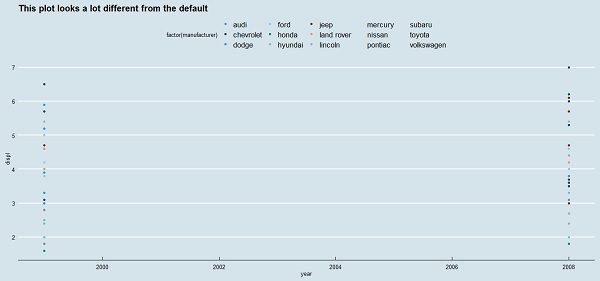
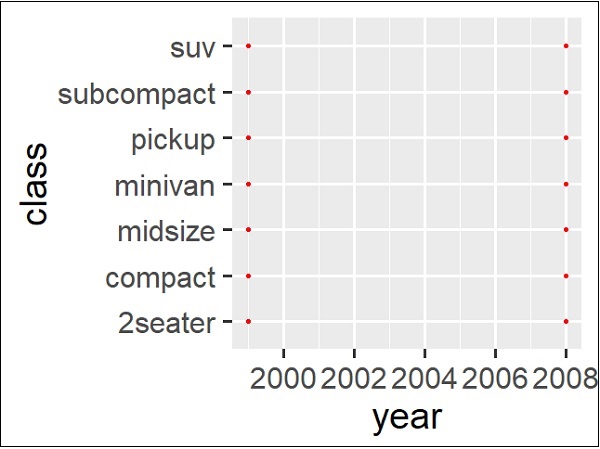
可以观察到,使用以前的主题管理后,刻度线、图例和其他元素的默认大小都比较小。轻松更改所有文本元素的大小。这可以通过创建一个自定义主题来实现,在以下步骤中可以看到,所有元素的大小都与 base_size 相对 (rel())。
> theme_set(theme_gray(base_size = 30))
> ggplot(mpg, aes(x=year, y=class))+geom_point(color="red")
广告