- ggplot2 教程
- ggplot2 - 首页
- ggplot2 - 简介
- ggplot2 - R 的安装
- ggplot2 - R 中的默认绘图
- ggplot2 - 坐标轴的使用
- ggplot2 - 图例的使用
- ggplot2 - 散点图 & 抖动图
- ggplot2 - 条形图 & 直方图
- ggplot2 - 饼图
- ggplot2 - 边缘图
- ggplot2 - 气泡图 & 计数图
- ggplot2 - 发散型图表
- ggplot2 - 主题
- ggplot2 - 多面板图
- ggplot2 - 多个图
- ggplot2 - 背景颜色
- ggplot2 - 时间序列
- ggplot2 有用资源
- ggplot2 - 快速指南
- ggplot2 - 有用资源
- ggplot2 - 讨论
ggplot2 - 图例的使用
坐标轴和图例统称为引导。它们允许我们从图中读取观测值,并将其映射回原始值。图例键和刻度标签都由刻度断点确定。图例和坐标轴根据绘图所需的相应刻度和几何图形自动生成。
我们将执行以下步骤来了解 ggplot2 中图例的工作原理:
在工作区中包含包和数据集
让我们创建相同的绘图,以关注使用 ggplot2 生成的图的图例:
> # Load ggplot
> library(ggplot2)
>
> # Read in dataset
> data(iris)
>
> # Plot
> p <- ggplot(iris, aes(Sepal.Length, Petal.Length, colour=Species)) + geom_point()
> p
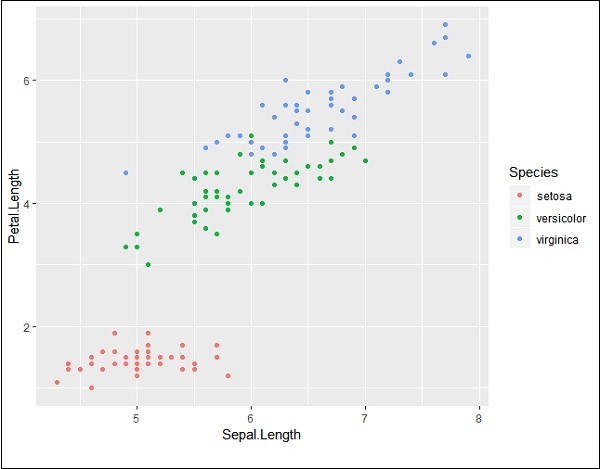
如果您观察该图,图例将在最左侧角创建,如下所示:

这里,图例包含给定数据集中各种类型的物种。
更改图例的属性
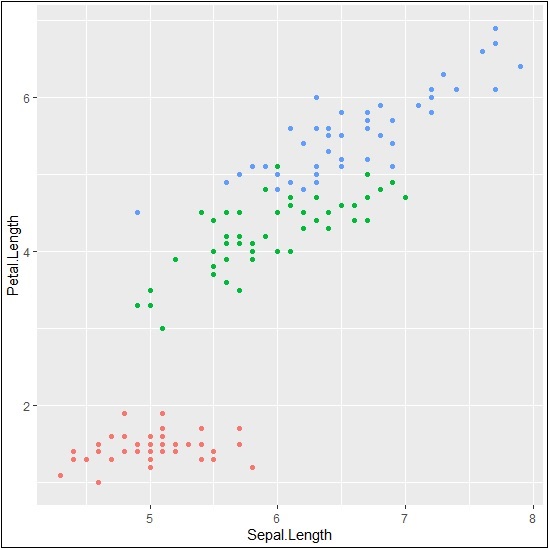
我们可以使用“legend.position”属性删除图例,并获得相应的输出:
> # Remove Legend
> p + theme(legend.position="none")
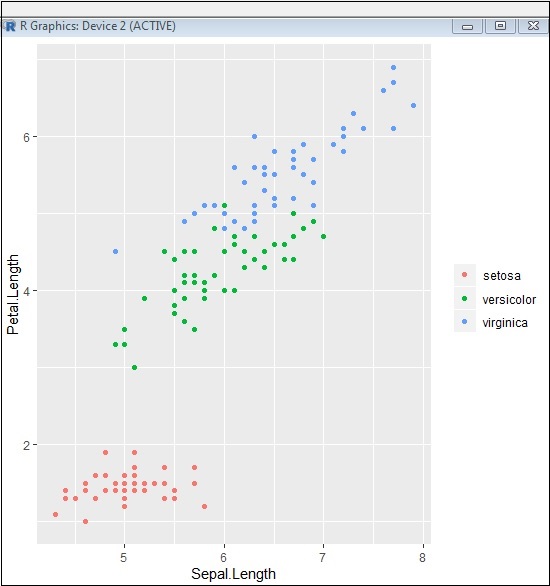
我们还可以使用“element_blank()”属性隐藏图例的标题,如下所示:
> # Hide the legend title
> p + theme(legend.title=element_blank())
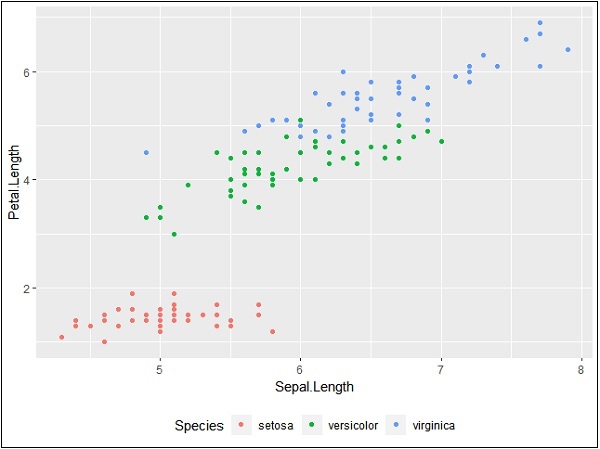
我们也可以根据需要使用图例位置。此属性用于生成准确的绘图表示。
> #Change the legend position
> p + theme(legend.position="top")
>
> p + theme(legend.position="bottom")
顶部表示

底部表示
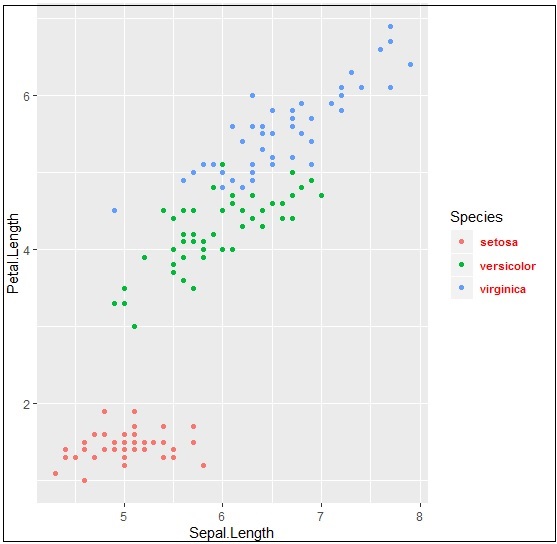
更改图例的字体样式
我们可以更改标题和其他图例属性的字体样式和字体类型,如下所示:
> #Change the legend title and text font styles
> # legend title
> p + theme(legend.title = element_text(colour = "blue", size = 10, + face = "bold"))
> # legend labels
> p + theme(legend.text = element_text(colour = "red", size = 8, + face = "bold"))
生成的输出如下所示:

后续章节将重点介绍各种类型的绘图以及各种背景属性(如颜色、主题)以及它们在数据科学角度的重要性。
广告