- LeafletJS 教程
- LeafletJS - 首页
- LeafletJS - 快速入门
- LeafletJS - 标记
- LeafletJS - 矢量图层
- LeafletJS - 多线 & 多边形
- LeafletJS - 图层组
- LeafletJS - 事件处理
- LeafletJS - 叠加层
- LeafletJS - 控件
- LeafletJS 有用资源
- LeafletJS - 快速指南
- LeafletJS - 有用资源
- LeafletJS - 讨论
LeafletJS - 多线和多边形
在上一章中,我们学习了如何添加各种形状,例如圆形、多边形、矩形、多线段等。在本章中,让我们讨论如何添加多边形、多矩形和多线段。
多线段
要使用 Leaflet JavaScript 库在地图上绘制多线段叠加层,请按照以下步骤操作:
步骤 1 − 通过传递 <div> 元素(字符串或对象)和地图选项(可选)来创建一个 Map 对象。
步骤 2 − 通过传递所需瓦片的 URL 来创建一个 Layer 对象。
步骤 3 − 使用 Map 类的 addLayer() 方法将图层对象添加到地图。
步骤 4 − 创建一个 latlangs 变量来保存绘制多线段的点。
// Creating latlng object
var latlang = [
   [[17.385044, 78.486671], [16.506174, 80.648015], [17.686816, 83.218482]],
   [[13.082680, 80.270718], [12.971599, 77.594563],[15.828126, 78.037279]]
];
步骤 5 − 使用 L.multiPolyline() 函数创建一个多线段。将位置作为变量传递以绘制多线段,并使用选项指定线的颜色和粗细。
// Creating multi polyline options
var multiPolyLineOptions = {color:'red'};

// Creating multi polylines
var multipolyline = L.multiPolyline(latlang , multiPolyLineOptions);
步骤 6 − 使用 Multipolyline 类的 addTo() 方法将多线段添加到地图。
// Adding multi polyline to map
multipolyline.addTo(map);
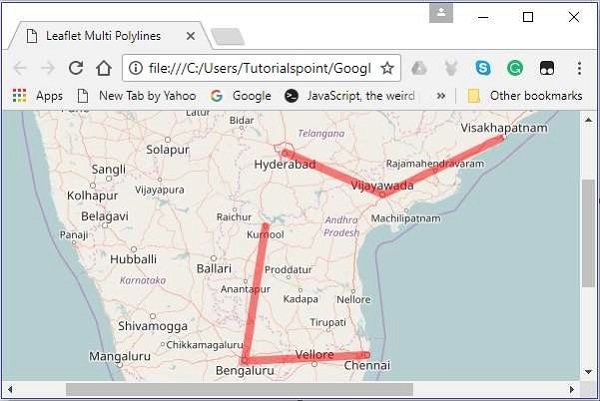
示例
以下是绘制覆盖海德拉巴、维杰亚瓦达和维沙卡帕特南;以及库尔诺尔、班加罗尔和钦奈等城市的代码。
<!DOCTYPE html>
<html>
   <head>
      <title>Leaflet Multi Polylines</title>
      <link rel = "stylesheet" href = "http://cdn.leafletjs.com/leaflet-0.7.3/leaflet.css"/>
      <script src = "http://cdn.leafletjs.com/leaflet-0.7.3/leaflet.js"></script>
   </head>

   <body>
      <div id = "map" style = "width: 900px; height: 580px"></div>
      <script>
         // Creating map options
         var mapOptions = {
            center: [16.506174, 80.648015],
            zoom: 7
         }
         // Creating a map object
         var map = new L.map('map', mapOptions);

         // Creating a Layer object
         var layer = new L.TileLayer('http://{s}.tile.openstreetmap.org/{z}/{x}/{y}.png');

         // Adding layer to the map
         map.addLayer(layer);

         // Creating latlng object
         var latlang = [
            [[17.385044, 78.486671], [16.506174, 80.648015], [17.686816, 83.218482]],
            [[13.082680, 80.270718], [12.971599, 77.594563],[15.828126, 78.037279]]
         ];

         // Creating poly line options
         var multiPolyLineOptions = {color:'red'};

         // Creating multi poly-lines
         var multipolyline = L.multiPolyline(latlang , multiPolyLineOptions);

         // Adding multi poly-line to map
         multipolyline.addTo(map);
      </script>
   </body>

</html>
它会生成以下输出:
多边形
要使用 Leaflet JavaScript 库在地图上绘制多边形叠加层,请按照以下步骤操作:
步骤 1 − 通过传递 <div> 元素(字符串或对象)和地图选项(可选)来创建一个 Map 对象。
步骤 2 − 通过传递所需瓦片的 URL 来创建一个 Layer 对象。
步骤 3 − 使用 Map 类的 addLayer() 方法将图层对象添加到地图。
步骤 4 − 创建一个 latlangs 变量来保存绘制多边形的点。
// Creating latlng object
var latlang = [
   [[17.385044, 78.486671], [16.506174, 80.648015], [17.686816, 83.218482]],
   [[13.082680, 80.270718], [12.971599, 77.594563],[15.828126, 78.037279]]
];
步骤 5 − 使用 L.multiPolygon() 函数创建一个多边形。将位置作为变量传递以绘制多边形,并使用选项指定线的颜色和粗细。
// Creating multi polygon options
var multiPolygonOptions = {color:'red'};

// Creating multi polygon
var multipolygon = L.multiPolygon(latlang , multiPolygonOptions);
步骤 6 − 使用 MultiPolygon 类的 addTo() 方法将多边形添加到地图。
// Adding multi polygon to map
multipolygon.addTo(map);
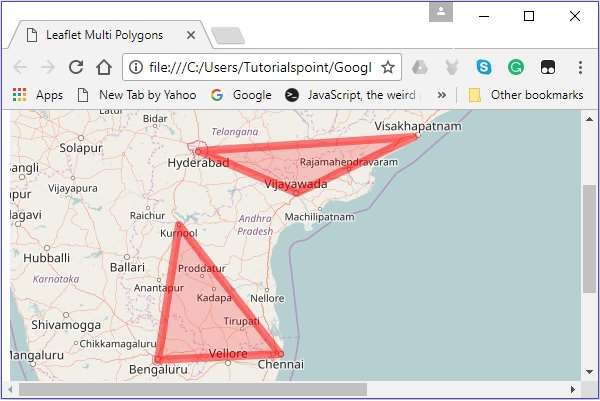
示例
以下是绘制经过海德拉巴、维杰亚瓦达和维沙卡帕特南;以及库尔诺尔、班加罗尔和钦奈等城市的代码。
<!DOCTYPE html>
<html>
   <head>
      <title>Leaflet Multi Polygons</title>
      <link rel = "stylesheet" href = "http://cdn.leafletjs.com/leaflet-0.7.3/leaflet.css"/>
      <script src = "http://cdn.leafletjs.com/leaflet-0.7.3/leaflet.js"></script>
   </head>

   <body>
      <div id = "map" style = "width: 900px; height: 580px"></div>
      <script>
         // Creating map options
         var mapOptions = {
            center: [16.506174, 80.648015],
            zoom: 7
         }
         // Creating a map object
         var map = new L.map('map', mapOptions);

         // Creating a Layer object
         var layer = new L.TileLayer('http://{s}.tile.openstreetmap.org/{z}/{x}/{y}.png');

         // Adding layer to the map
         map.addLayer(layer);

         // Creating latlng object
         var latlang = [
            [[17.385044, 78.486671], [16.506174, 80.648015], [17.686816, 83.218482]],
            [[13.082680, 80.270718], [12.971599, 77.594563],[15.828126, 78.037279]]
         ];
         // Creating multi polygon options
         var multiPolygonOptions = {color:'red', weight:8};

         // Creating multi polygons
         var multipolygon = L.multiPolygon(latlang , multiPolygonOptions);

         // Adding multi polygon to map
         multipolygon.addTo(map);
      </script>
   </body>

</html>
它会生成以下输出: