- Scikit Image 教程
- Scikit Image - 简介
- Scikit Image - 图像处理
- Scikit Image - Numpy 图像
- Scikit Image - 图像数据类型
- Scikit Image - 使用插件
- Scikit Image - 图像处理
- Scikit Image - 读取图像
- Scikit Image - 写入图像
- Scikit Image - 显示图像
- Scikit Image - 图像集合
- Scikit Image - 图像堆栈
- Scikit Image - 多张图像
Scikit Image - 使用 Plotly
Python 中的Plotly通常被称为“plotly.py”。它是一个免费的开源绘图库,构建在“plotly.js”之上。Plotly.py 提供了一套丰富的功能,并支持超过 40 种独特的图表类型。它广泛用于金融分析、地理制图、科学可视化、3D 绘图和数据分析应用程序。
它提供了一个交互式界面,允许用户探索和交互数据可视化。它提供了缩放、平移、工具提示和悬停效果等功能,使分析和理解复杂数据集变得容易。
Scikit Image 使用 Plotly
Plotly.py可以与 scikit-image 库一起使用,以实现与图像处理相关的各种数据可视化任务。要设置 plotly,您需要确保库已安装并已正确配置。
使用 pip 安装 plotly
在命令提示符中执行以下命令以安装 plotly 模块。这是一种从 PyPi 安装最新 Plotly 包的简单方法。
pip install plotly
使用 conda 安装 plotly
如果您已经在系统中使用 Anaconda 发行版,则可以直接使用 conda 包管理器来安装 plotly。
conda install -c plotly plotly
安装 Plotly 后,您可以使用以下语句将其导入到 Python 脚本或交互式会话中:
import plotly
这将导入 Plotly 中必要的模块,以创建交互式和可自定义的可视化效果。以下是一些基本的 Python 程序,演示了如何将 Plotly 与 scikit-image 一起使用,以有效地执行图像处理任务中的数据可视化。
示例 1
以下示例使用Plotly.express.imshow()方法显示 RBG 图像。
import plotly.express as px
from skimage import io

# Read an image
image = io.imread('Images/Tajmahal.jpg')
# Display the image using Plotly
fig = px.imshow(image)
fig.show()
输出
执行上述程序后,您将获得以下输出:

示例 2
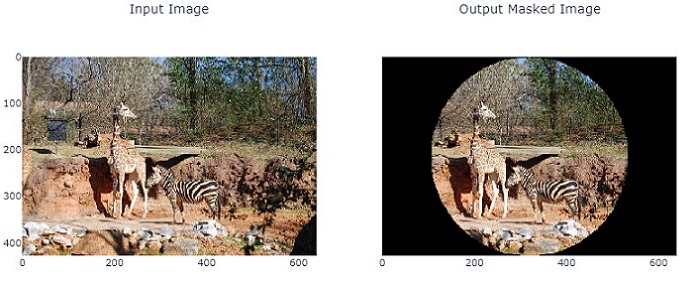
以下示例演示了如何使用 scikit-image 对图像应用圆形遮罩,并使用 Plotly 并排显示原始图像和遮罩图像。
import matplotlib.pyplot as plt
from skimage import io
import numpy as np

# Load the image
image_path = 'Images_/Zoo.jpg'
image = io.imread(image_path)
image_copy = np.copy(image)

# Create circular mask
rows, cols, _ = image.shape
row, col = np.ogrid[:rows, :cols]
center_row, center_col = rows / 2, cols / 2
radius = min(rows, cols) / 2
outer_disk_mask = ((row - center_row)**2 + (col - center_col)**2 > radius**2)

# Apply mask to image
image[outer_disk_mask] = 0

# Display the original and masked images using Matplotlib
fig, axes = plt.subplots(nrows=1, ncols=2, figsize=(10, 5))
axes[0].imshow(image_copy)
axes[0].set_title('Original Image')
axes[0].axis('off')
axes[1].imshow(image)
axes[1].set_title('Masked Image')
axes[1].axis('off')
plt.tight_layout()
plt.show()
输出
广告