- Bokeh 教程
- Bokeh - 首页
- Bokeh - 简介
- Bokeh - 环境设置
- Bokeh - 入门
- Bokeh - Jupyter Notebook
- Bokeh - 基本概念
- Bokeh - 使用 Glyph 绘制图形
- Bokeh - 面积图
- Bokeh - 圆形 Glyph
- Bokeh - 矩形、椭圆和多边形
- Bokeh - 扇形和弧形
- Bokeh - 专用曲线
- Bokeh - 设置范围
- Bokeh - 坐标轴
- Bokeh - 注释和图例
- Bokeh - Pandas
- Bokeh - ColumnDataSource
- Bokeh - 数据过滤
- Bokeh - 布局
- Bokeh - 图表工具
- Bokeh - 样式化视觉属性
- Bokeh - 自定义图例
- Bokeh - 添加小部件
- Bokeh - 服务器
- Bokeh - 使用 Bokeh 子命令
- Bokeh - 导出图表
- Bokeh - 嵌入图表和应用程序
- Bokeh - 扩展 Bokeh
- Bokeh - WebGL
- Bokeh - 使用 JavaScript 开发
- Bokeh 有用资源
- Bokeh - 快速指南
- Bokeh - 有用资源
- Bokeh - 讨论
Bokeh - 面积图
面积图是在共享共同索引的两个序列之间填充的区域。Bokeh 的 Figure 类有两个如下方法:
varea()
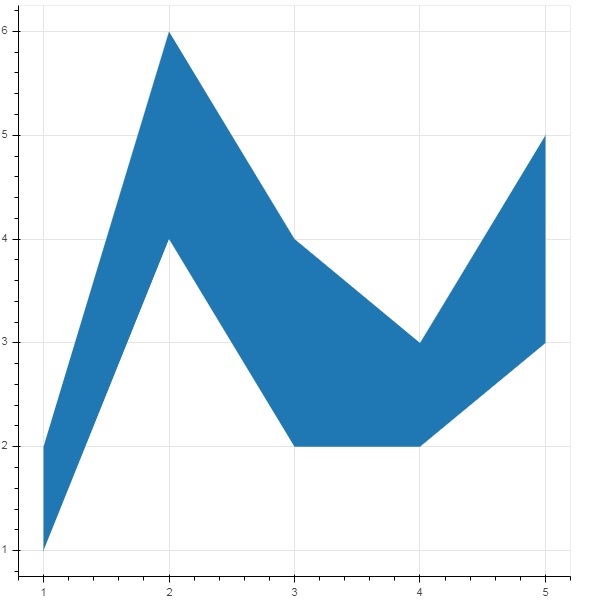
varea() 方法的输出是一个垂直方向的区域,它具有一个 x 坐标数组和两个 y 坐标数组 y1 和 y2,它们将填充在两者之间。
| 1 | x | 区域点的 x 坐标。 |
| 2 | y1 | 区域一侧点的 y 坐标。 |
| 3 | y2 | 区域另一侧点的 y 坐标。 |
示例
from bokeh.plotting import figure, output_file, show
fig = figure()
x = [1, 2, 3, 4, 5]
y1 = [2, 6, 4, 3, 5]
y2 = [1, 4, 2, 2, 3]
fig.varea(x = x,y1 = y1,y2 = y2)
output_file('area.html')
show(fig)
输出

harea()
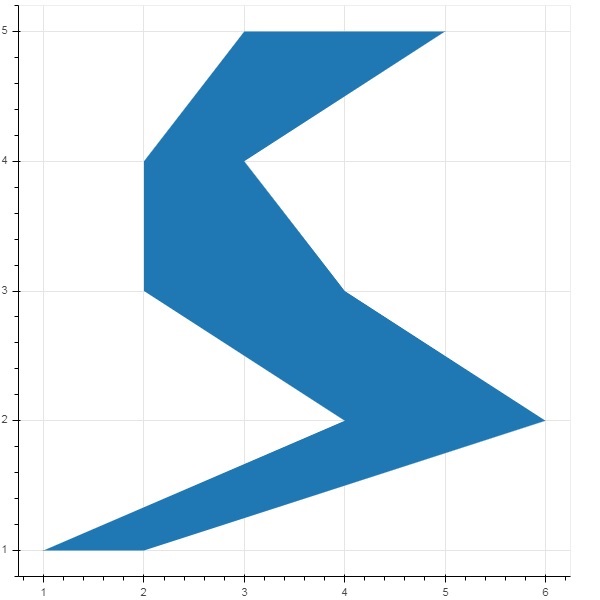
另一方面,harea() 方法需要 x1、x2 和 y 参数。
| 1 | x1 | 区域一侧点的 x 坐标。 |
| 2 | x2 | 区域另一侧点的 x 坐标。 |
| 3 | y | 区域点的 y 坐标。 |
示例
from bokeh.plotting import figure, output_file, show
fig = figure()
y = [1, 2, 3, 4, 5]
x1 = [2, 6, 4, 3, 5]
x2 = [1, 4, 2, 2, 3]
fig.harea(x1 = x1,x2 = x2,y = y)
output_file('area.html')
show(fig)
输出

广告