- Bokeh 教程
- Bokeh - 首页
- Bokeh - 简介
- Bokeh - 环境搭建
- Bokeh - 快速入门
- Bokeh - Jupyter Notebook
- Bokeh - 基本概念
- Bokeh - 使用 Glyphs 绘图
- Bokeh - 面积图
- Bokeh - 圆形 Glyphs
- Bokeh - 矩形、椭圆和多边形
- Bokeh - 扇形和弧形
- Bokeh - 特殊曲线
- Bokeh - 设置范围
- Bokeh - 坐标轴
- Bokeh - 注释和图例
- Bokeh - Pandas
- Bokeh - ColumnDataSource
- Bokeh - 数据过滤
- Bokeh - 布局
- Bokeh - 绘图工具
- Bokeh - 样式视觉属性
- Bokeh - 自定义图例
- Bokeh - 添加小部件
- Bokeh - 服务器
- Bokeh - 使用 Bokeh 子命令
- Bokeh - 导出图表
- Bokeh - 嵌入图表和应用程序
- Bokeh - 扩展 Bokeh
- Bokeh - WebGL
- Bokeh - 使用 JavaScript 开发
- Bokeh 有用资源
- Bokeh 快速指南
- Bokeh - 有用资源
- Bokeh - 讨论
Bokeh 快速指南
Bokeh - 简介
Bokeh 是一个用于 Python 的数据可视化库。与 Matplotlib 和 Seaborn(也是 Python 数据可视化包)不同,Bokeh 使用 HTML 和 JavaScript 渲染其图表。因此,它被证明对于开发基于 Web 的仪表板非常有用。
Bokeh 项目由 NumFocus 赞助 https://numfocus.org/. NumFocus 还支持 PyData,这是一个参与开发其他重要工具(如 NumPy、Pandas 等)的教育项目。Bokeh 可以轻松地与这些工具连接,并生成交互式图表、仪表板和数据应用程序。
特性
Bokeh 主要将数据源转换为 JSON 文件,该文件用作 BokehJS(一个 JavaScript 库,用 TypeScript 编写的库)的输入,BokehJS 又在现代浏览器中渲染可视化效果。
Bokeh 的一些重要特性如下:
灵活性
Bokeh 可用于常见的绘图需求以及自定义和复杂的用例。
生产力
Bokeh 可以轻松地与其他流行的 Pydata 工具(如 Pandas 和 Jupyter Notebook)交互。
交互性
这是 Bokeh 相对于 Matplotlib 和 Seaborn 的一个重要优势,两者都生成静态图表。Bokeh 创建交互式图表,这些图表会在用户与它们交互时发生变化。您可以为您的受众提供各种选项和工具,以便从不同角度推断和查看数据,以便用户可以执行“假设分析”。
强大
通过添加自定义 JavaScript,可以为专门的用例生成可视化效果。
可共享
图表可以嵌入到Flask或Django支持的 Web 应用程序的输出中。它们也可以渲染在
Jupyter
笔记本中。开源
Bokeh 是一个开源项目。它是在 Berkeley Source Distribution (BSD) 许可下分发的。其源代码可在 https://github.com/bokeh/bokeh. 获取。
Bokeh - 环境搭建
Bokeh 只能安装在CPython 2.7和3.5+版本上,标准发行版和 Anaconda 发行版均可。撰写本教程时的 Bokeh 最新版本为 1.3.4 版。Bokeh 包具有以下依赖项:
- jinja2 >= 2.7
- numpy >= 1.7.1
- packaging >= 16.8
- pillow >= 4.0
- python-dateutil >= 2.1
- pyyaml >= 3.10
- six >= 1.5.2
- tornado >= 4.3
通常,使用 Python 的内置包管理器 PIP 安装 Bokeh 时,会自动安装上述包,如下所示:
pip3 install bokeh
如果您使用的是 Anaconda 发行版,请使用 conda 包管理器,如下所示:
conda install bokeh
除了上述依赖项之外,您可能还需要其他包(如 pandas、psutil 等)来满足特定目的。
要验证 Bokeh 是否已成功安装,请在 Python 终端导入 bokeh 包并检查其版本:
>>> import bokeh
>>> bokeh.__version__
'1.3.4'
Bokeh - 快速入门
在两个 numpy 数组之间创建简单的线图非常简单。首先,从bokeh.plotting模块导入以下函数:
from bokeh.plotting import figure, output_file, show
figure()函数创建一个新的绘图图形。
output_file()函数用于指定用于存储输出的 HTML 文件。
show()函数在浏览器或笔记本中显示 Bokeh 图形。
接下来,设置两个 numpy 数组,其中第二个数组是第一个数组的正弦值。
import numpy as np
import math
x = np.arange(0, math.pi*2, 0.05)
y = np.sin(x)
要获得 Bokeh 图形对象,请指定标题和 x 轴和 y 轴标签,如下所示:
p = figure(title = "sine wave example", x_axis_label = 'x', y_axis_label = 'y')
图形对象包含一个 line() 方法,该方法将线形添加到图形中。它需要 x 轴和 y 轴的数据序列。
p.line(x, y, legend = "sine", line_width = 2)
最后,设置输出文件并调用 show() 函数。
output_file("sine.html")
show(p)
这将在“sine.html”中渲染线图,并将在浏览器中显示。
完整的代码及其输出如下:
from bokeh.plotting import figure, output_file, show
import numpy as np
import math
x = np.arange(0, math.pi*2, 0.05)
y = np.sin(x)
output_file("sine.html")
p = figure(title = "sine wave example", x_axis_label = 'x', y_axis_label = 'y')
p.line(x, y, legend = "sine", line_width = 2)
show(p)
浏览器上的输出

Bokeh - Jupyter Notebook
在 Jupyter Notebook 中显示 Bokeh 图形与上述方法非常相似。您需要做的唯一更改是从 bokeh.plotting 模块导入 output_notebook 而不是 output_file。
from bokeh.plotting import figure, output_notebook, show
对 output_notebook() 函数的调用将 Jupyter Notebook 的输出单元格设置为 show() 函数的目标,如下所示:
output_notebook()
show(p)
在 Notebook 单元格中输入代码并运行它。正弦波将显示在笔记本中。
Bokeh - 基本概念
Bokeh 包提供了两个接口,可以使用它们执行各种绘图操作。
bokeh.models
此模块是一个低级接口。它为应用程序开发人员在开发可视化效果方面提供了很大的灵活性。Bokeh 图表会生成一个包含场景的视觉和数据方面的对象,该对象由 BokehJS 库使用。构成 Bokeh 场景图的低级对象称为模型。
bokeh.plotting
这是一个更高级别的接口,具有组合视觉 Glyphs 的功能。此模块包含 Figure 类的定义。它实际上是 bokeh.models 模块中定义的 plot 类的子类。
Figure 类简化了图表的创建。它包含各种方法来绘制不同的矢量化图形 Glyphs。Glyphs 是 Bokeh 图表的构建块,例如线、圆、矩形和其他形状。
bokeh.application
Bokeh 包的 Application 类是一个轻量级的工厂,用于创建 Bokeh 文档。文档是 Bokeh 模型的容器,用于反映到客户端 BokehJS 库。
bokeh.server
它提供可自定义的 Bokeh Server Tornado 核心应用程序。服务器用于与您选择的受众共享和发布交互式图表和应用程序。
Bokeh - 使用 Glyphs 绘图
任何图表通常都由一个或多个几何形状组成,例如线、圆、矩形等。这些形状包含有关相应数据集的视觉信息。在 Bokeh 术语中,这些几何形状称为 Glyphs。使用bokeh.plotting 接口构建的 Bokeh 图表使用一组默认工具和样式。但是,可以使用可用的绘图工具自定义样式。
图表类型
使用 Glyphs 创建的不同类型的图表如下所示:
线图
此类型的图表可用于以线的形式可视化点沿 x 轴和 y 轴的移动。它用于执行时间序列分析。
条形图
这通常用于指示数据集中特定列或字段的每个类别的计数。
面片图
此图表指示特定颜色阴影中的一组点。此类型的图表用于区分同一数据集中不同的组。
散点图
此类型的图表用于可视化两个变量之间的关系并指示它们之间相关性的强度。
不同的 Glyph 图表是通过调用 Figure 类的相应方法形成的。图形对象通过以下构造函数获得:
from bokeh.plotting import figure
figure(**kwargs)
图形对象可以通过各种关键字参数进行自定义。
| 序号 | 标题 | 设置图表的标题 |
|---|---|---|
| 1 | x_axis_label | 设置 x 轴的标题 |
| 2 | y_axis_label | 设置 y 轴的标题 |
| 3 | plot_width | 设置图形的宽度 |
| 4 | plot_height | 设置图形的高度 |
线图
Figure 对象的line() 方法将线形添加到 Bokeh 图形中。它需要 x 和 y 参数作为数据数组,以显示它们的线性关系。
from bokeh.plotting import figure, show
fig = figure()
fig.line(x,y)
show(fig)
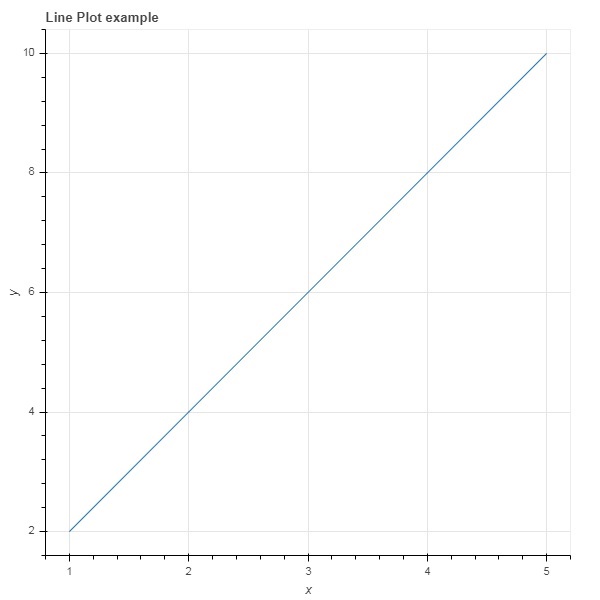
以下代码以 Python 列表对象的形式渲染两个值集之间的简单线图:
from bokeh.plotting import figure, output_file, show
x = [1,2,3,4,5]
y = [2,4,6,8,10]
output_file('line.html')
fig = figure(title = 'Line Plot example', x_axis_label = 'x', y_axis_label = 'y')
fig.line(x,y)
show(fig)
输出
条形图
图形对象有两种不同的方法可以构建条形图
hbar()
条形图水平显示在绘图宽度上。hbar() 方法具有以下参数:
| 序号 | y | 水平条形的中心的 y 坐标。 |
|---|---|---|
| 1 | height | 垂直条形的高度。 |
| 2 | right | 右边缘的 x 坐标。 |
| 3 | left | 左边缘的 x 坐标。 |
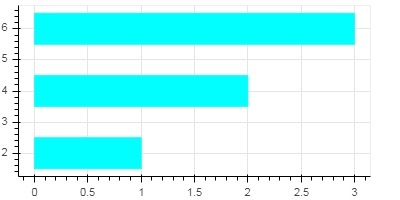
以下代码是使用 Bokeh 的水平条形图示例。
from bokeh.plotting import figure, output_file, show
fig = figure(plot_width = 400, plot_height = 200)
fig.hbar(y = [2,4,6], height = 1, left = 0, right = [1,2,3], color = "Cyan")
output_file('bar.html')
show(fig)
输出
vbar()
条形图垂直显示在绘图高度上。vbar() 方法具有以下参数:
| 序号 | x | 垂直条形的中心的 x 坐标。 |
|---|---|---|
| 1 | width | 垂直条形的宽度。 |
| 2 | top | 顶部边缘的 y 坐标。 |
| 3 | bottom | 底部边缘的 y 坐标。 |
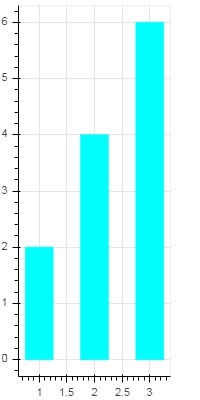
以下代码显示垂直条形图:
from bokeh.plotting import figure, output_file, show
fig = figure(plot_width = 200, plot_height = 400)
fig.vbar(x = [1,2,3], width = 0.5, bottom = 0, top = [2,4,6], color = "Cyan")
output_file('bar.html')
show(fig)
输出
面片图
在 Bokeh 中,用特定颜色对空间区域进行着色以显示具有相似属性的区域或组的图表称为面片图。Figure 对象为此目的具有 patch() 和 patches() 方法。
patch()
此方法将面片形添加到给定的图形中。该方法具有以下参数:
| 1 | x | 面片点的 x 坐标。 |
| 2 | y | 面片点的 y 坐标。 |
通过以下 Python 代码获得简单的面片图:
from bokeh.plotting import figure, output_file, show
p = figure(plot_width = 300, plot_height = 300)
p.patch(x = [1, 3,2,4], y = [2,3,5,7], color = "green")
output_file('patch.html')
show(p)
输出

patches()
此方法用于绘制多个多边形面片。它需要以下参数:
| 1 | xs | 所有面片的 x 坐标,以“列表的列表”的形式给出。 |
| 2 | ys | 所有面片的 y 坐标,以“列表的列表”的形式给出。 |
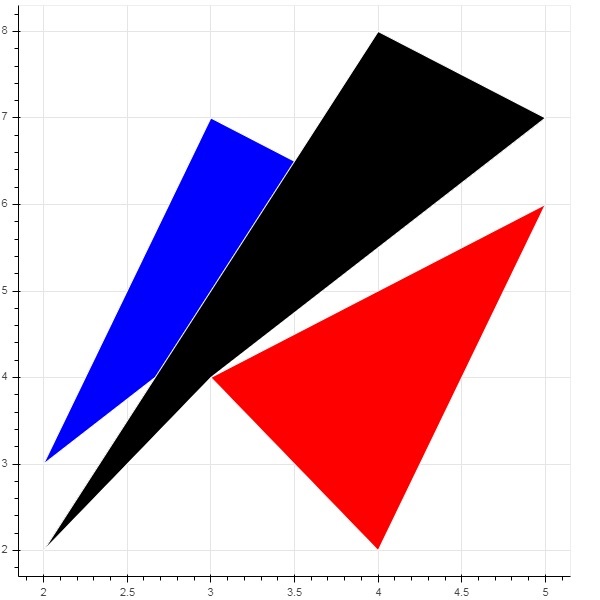
作为 patches() 方法的示例,运行以下代码:
from bokeh.plotting import figure, output_file, show
xs = [[5,3,4], [2,4,3], [2,3,5,4]]
ys = [[6,4,2], [3,6,7], [2,4,7,8]]
fig = figure()
fig.patches(xs, ys, fill_color = ['red', 'blue', 'black'], line_color = 'white')
output_file('patch_plot.html')
show(fig)
输出
散点标记
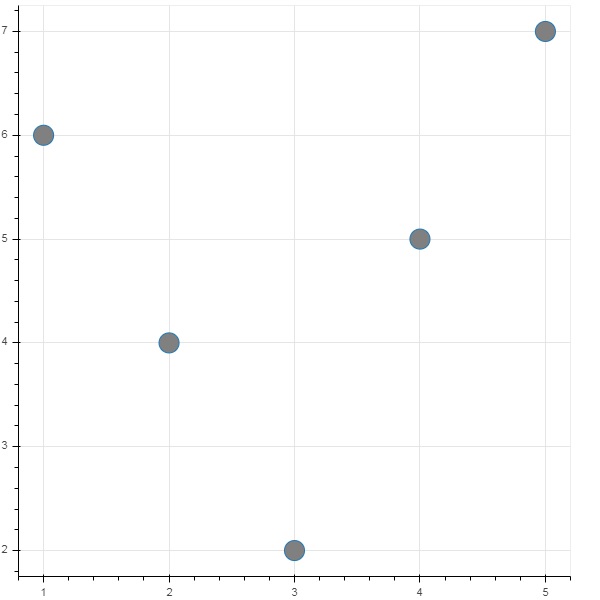
散点图非常常用,用于确定两个变量之间的二元关系。使用 Bokeh 为其添加了增强的交互性。通过调用 Figure 对象的 scatter() 方法获得散点图。它使用以下参数:
| 1 | x | 中心 x 坐标的值或字段名称 |
| 2 | y | 中心 y 坐标的值或字段名称 |
| 3 | size | 屏幕单位中大小的值或字段名称 |
| 4 | marker | 标记类型的值或字段名称 |
| 5 | color | 设置填充和线条颜色 |
Bokeh 中定义了以下标记类型常量:
- 星号
- 圆形
- 带十字的圆形
- 带 X 的圆形
- 十字
- 短划线
- 菱形
- 带十字的菱形
- 六边形
- 倒三角形
- 正方形
- 带十字的正方形
- 带 X 的正方形
- 三角形
- X
以下 Python 代码生成带有圆形标记的散点图。
from bokeh.plotting import figure, output_file, show
fig = figure()
fig.scatter([1, 4, 3, 2, 5], [6, 5, 2, 4, 7], marker = "circle", size = 20, fill_color = "grey")
output_file('scatter.html')
show(fig)
输出
Bokeh - 面积图
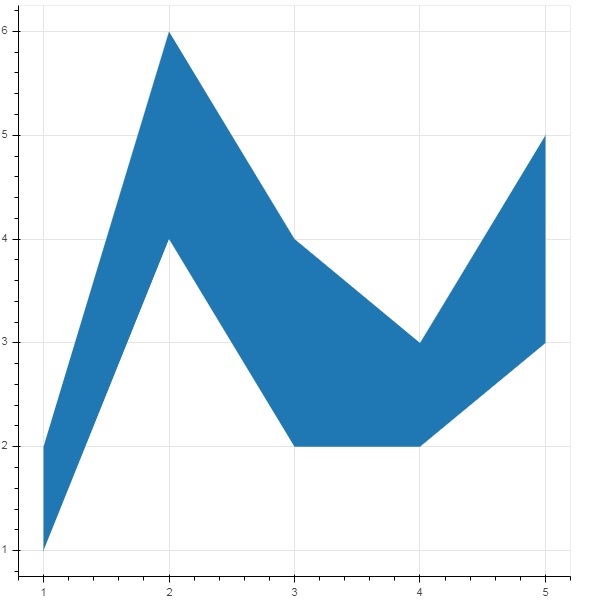
面积图是在共享公共索引的两个序列之间填充的区域。Bokeh 的 Figure 类具有以下两种方法:
varea()
varea() 方法的输出是一个垂直方向的区域,它有一个 x 坐标数组和两个 y 坐标数组 y1 和 y2,它们之间将被填充。
| 1 | x | 区域点的 x 坐标。 |
| 2 | y1 | 区域一侧点的 y 坐标。 |
| 3 | y2 | 区域另一侧点的 y 坐标。 |
示例
from bokeh.plotting import figure, output_file, show
fig = figure()
x = [1, 2, 3, 4, 5]
y1 = [2, 6, 4, 3, 5]
y2 = [1, 4, 2, 2, 3]
fig.varea(x = x,y1 = y1,y2 = y2)
output_file('area.html')
show(fig)
输出
harea()
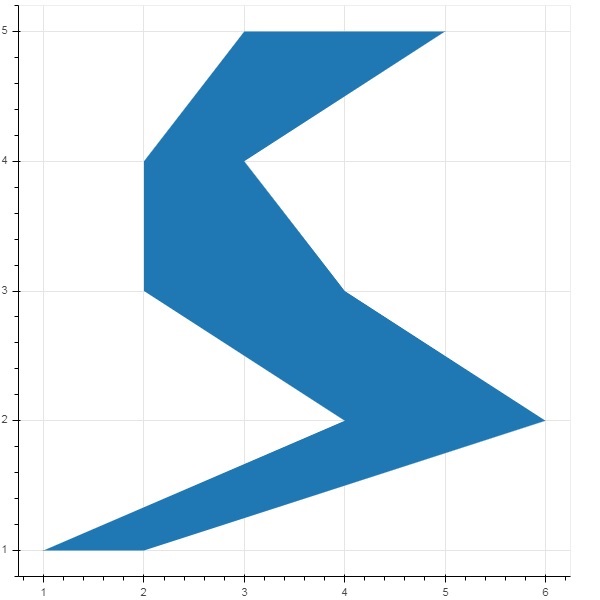
另一方面,harea() 方法需要 x1、x2 和 y 参数。
| 1 | x1 | 区域一侧点的 x 坐标。 |
| 2 | x2 | 区域另一侧点的 x 坐标。 |
| 3 | y | 区域各点的 y 坐标。 |
示例
from bokeh.plotting import figure, output_file, show
fig = figure()
y = [1, 2, 3, 4, 5]
x1 = [2, 6, 4, 3, 5]
x2 = [1, 4, 2, 2, 3]
fig.harea(x1 = x1,x2 = x2,y = y)
output_file('area.html')
show(fig)
输出
Bokeh - 圆形 Glyphs
图形对象有很多方法,可以使用这些方法绘制不同形状的矢量化字形,例如圆形、矩形、多边形等。
绘制圆形字形可以使用以下方法:
circle()
circle() 方法向图形添加一个圆形字形,需要其中心的 x 和y 坐标。此外,还可以使用fill_color、line-color、line_width等参数进行配置。
circle_cross()
circle_cross() 方法添加一个中心带有“+”号十字的圆形字形。
circle_x()
circle_x() 方法添加一个中心带有“X”号十字的圆形字形。
示例
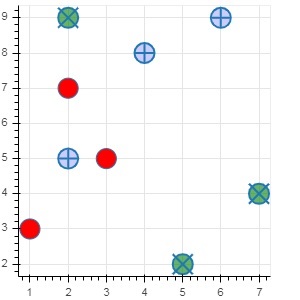
以下示例显示了添加到 Bokeh 图形中的各种圆形字形的用法:
from bokeh.plotting import figure, output_file, show
plot = figure(plot_width = 300, plot_height = 300)
plot.circle(x = [1, 2, 3], y = [3,7,5], size = 20, fill_color = 'red')
plot.circle_cross(x = [2,4,6], y = [5,8,9], size = 20, fill_color = 'blue',fill_alpha = 0.2, line_width = 2)
plot.circle_x(x = [5,7,2], y = [2,4,9], size = 20, fill_color = 'green',fill_alpha = 0.6, line_width = 2)
show(plot)
输出
Bokeh - 矩形、椭圆和多边形
可以在 Bokeh 图形中渲染矩形、椭圆和多边形。Figure 类的rect() 方法根据中心的 x 和 y 坐标、宽度和高度添加矩形字形。另一方面,square() 方法具有 size 参数来确定尺寸。
ellipse() 和 oval() 方法分别添加椭圆和椭圆字形。它们使用与 rect() 类似的签名,具有 x、y、w 和 h 参数。此外,angle 参数确定与水平线的旋转角度。
示例
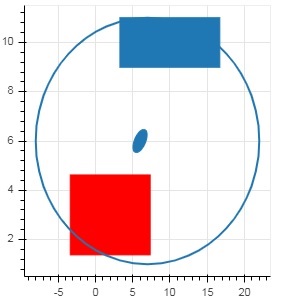
以下代码显示了不同形状字形方法的用法:
from bokeh.plotting import figure, output_file, show
fig = figure(plot_width = 300, plot_height = 300)
fig.rect(x = 10,y = 10,width = 100, height = 50, width_units = 'screen', height_units = 'screen')
fig.square(x = 2,y = 3,size = 80, color = 'red')
fig.ellipse(x = 7,y = 6, width = 30, height = 10, fill_color = None, line_width = 2)
fig.oval(x = 6,y = 6,width = 2, height = 1, angle = -0.4)
show(fig)
输出
Bokeh - 扇形和弧形
arc() 方法根据 x 和 y 坐标、起始和结束角度以及半径绘制一条简单的线弧。角度以弧度表示,而半径可以是屏幕单位或数据单位。扇形是一个填充的弧。
wedge() 方法与 arc() 方法具有相同的属性。这两种方法都提供了可选的 direction 属性,可以是 clock 或 anticlock,用于确定弧/扇形的渲染方向。annular_wedge() 函数渲染内外半径两条弧之间的填充区域。
示例
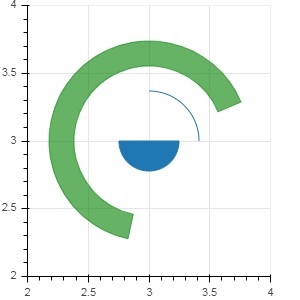
这是一个添加到 Bokeh 图形的弧和扇形字形的示例:
from bokeh.plotting import figure, output_file, show
import math
fig = figure(plot_width = 300, plot_height = 300)
fig.arc(x = 3, y = 3, radius = 50, radius_units = 'screen', start_angle = 0.0, end_angle = math.pi/2)
fig.wedge(x = 3, y = 3, radius = 30, radius_units = 'screen',
start_angle = 0, end_angle = math.pi, direction = 'clock')
fig.annular_wedge(x = 3,y = 3, inner_radius = 100, outer_radius = 75,outer_radius_units = 'screen',
inner_radius_units = 'screen',start_angle = 0.4, end_angle = 4.5,color = "green", alpha = 0.6)
show(fig)
输出
Bokeh - 特殊曲线
bokeh.plotting API 支持用于渲染以下专用曲线的方法:
beizer()
此方法向图形对象添加一条贝塞尔曲线。贝塞尔曲线是计算机图形学中使用的一种参数曲线。其他用途包括计算机字体和动画的设计、用户界面设计以及平滑光标轨迹。
在矢量图形中,贝塞尔曲线用于模拟可以无限缩放的平滑曲线。“路径”是连接的贝塞尔曲线的组合。
beizer() 方法具有以下定义的参数:
| 1 | x0 | 起始点的 x 坐标。 |
| 2 | y0 | 起始点的 y 坐标。 |
| 3 | x1 | 结束点的 x 坐标。 |
| 4 | y1 | 结束点的 y 坐标。 |
| 5 | cx0 | 第一个控制点的 x 坐标。 |
| 6 | cy0 | 第一个控制点的 y 坐标。 |
| 7 | cx1 | 第二个控制点的 x 坐标。 |
| 8 | cy1 | 第二个控制点的 y 坐标。 |
所有参数的默认值为 None。
示例
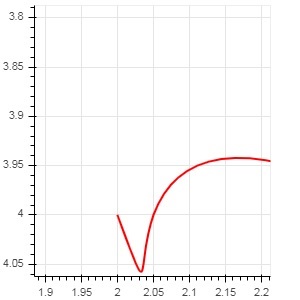
以下代码生成一个 HTML 页面,在 Bokeh 绘图中显示贝塞尔曲线和抛物线:
x = 2
y = 4
xp02 = x+0.4
xp01 = x+0.1
xm01 = x-0.1
yp01 = y+0.2
ym01 = y-0.2
fig = figure(plot_width = 300, plot_height = 300)
fig.bezier(x0 = x, y0 = y, x1 = xp02, y1 = y, cx0 = xp01, cy0 = yp01,
cx1 = xm01, cy1 = ym01, line_color = "red", line_width = 2)
输出
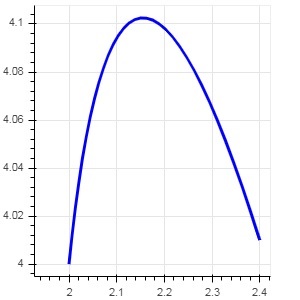
quadratic()
此方法向 bokeh 图形添加一个抛物线字形。该函数与 beizer() 具有相同的参数,除了cx0 和cx1。
示例
以下代码生成一条二次曲线。
x = 2
y = 4
xp02 = x + 0.3
xp01 = x + 0.2
xm01 = x - 0.4
yp01 = y + 0.1
ym01 = y - 0.2
x = x,
y = y,
xp02 = x + 0.4,
xp01 = x + 0.1,
yp01 = y + 0.2,
fig.quadratic(x0 = x, y0 = y, x1 = x + 0.4, y1 = y + 0.01, cx = x + 0.1,
cy = y + 0.2, line_color = "blue", line_width = 3)
输出
Bokeh - 设置范围
Bokeh 会自动设置绘图数据轴的数值范围,同时考虑正在处理的数据集。但是,有时您可能希望显式定义 x 轴和 y 轴的值范围。这可以通过为 figure() 函数分配 x_range 和 y_range 属性来完成。
这些范围是使用 range1d() 函数定义的。
示例
xrange = range1d(0,10)
要将此范围对象用作 x_range 属性,请使用以下代码:
fig = figure(x,y,x_range = xrange)
Bokeh - 坐标轴
本章将讨论各种类型的轴。
| 序号 | 坐标轴 | 描述 |
|---|---|---|
| 1 | 分类轴 | bokeh 绘图在 x 轴和 y 轴上显示数值数据。为了在任一轴上使用分类数据,我们需要指定一个 FactorRange 来指定其中一个的分类维度。 |
| 2 | 对数刻度轴 | 如果 x 和 y 数据序列之间存在幂律关系,则最好在两个轴上都使用对数刻度。 |
| 3 | 双轴 | 可能需要显示多个轴,这些轴在一个绘图图形上表示不同的范围。可以通过定义extra_x_range 和extra_y_range 属性来配置图形对象。 |
分类轴
在之前的示例中,Bokeh 绘图在 x 轴和 y 轴上都显示数值数据。为了在任一轴上使用分类数据,我们需要指定一个 FactorRange 来指定其中一个的分类维度。例如,要使用给定列表中的字符串作为 x 轴:
langs = ['C', 'C++', 'Java', 'Python', 'PHP']
fig = figure(x_range = langs, plot_width = 300, plot_height = 300)
示例
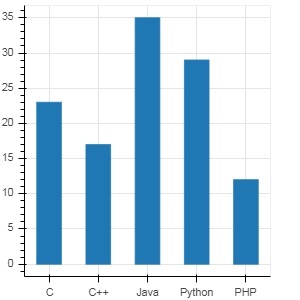
通过以下示例,显示了一个简单的条形图,显示了注册各种课程的学生人数。
from bokeh.plotting import figure, output_file, show
langs = ['C', 'C++', 'Java', 'Python', 'PHP']
students = [23,17,35,29,12]
fig = figure(x_range = langs, plot_width = 300, plot_height = 300)
fig.vbar(x = langs, top = students, width = 0.5)
show(fig)
输出
要以不同的颜色显示每个条形,请将 vbar() 函数的 color 属性设置为颜色值列表。
cols = ['red','green','orange','navy', 'cyan']
fig.vbar(x = langs, top = students, color = cols,width=0.5)
输出

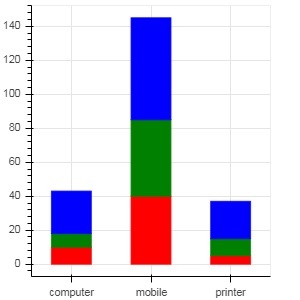
要使用 vbar_stack() 或 hbar_stack() 函数渲染垂直(或水平)堆叠条形图,请将 stackers 属性设置为要连续堆叠的字段列表,并将 source 属性设置为包含每个字段对应值的 dict 对象。
在以下示例中,sales 是一个字典,显示了三个产品在三个月的销售数据。
from bokeh.plotting import figure, output_file, show
products = ['computer','mobile','printer']
months = ['Jan','Feb','Mar']
sales = {'products':products,
   'Jan':[10,40,5],
   'Feb':[8,45,10],
   'Mar':[25,60,22]}
cols = ['red','green','blue']#,'navy', 'cyan']
fig = figure(x_range = products, plot_width = 300, plot_height = 300)
fig.vbar_stack(months, x = 'products', source = sales, color = cols,width = 0.5)
show(fig)
输出
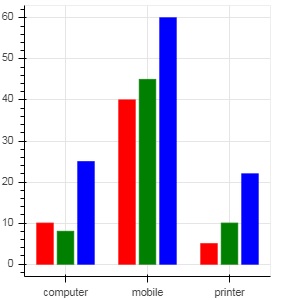
通过使用bokeh.transform 模块中的 dodge() 函数为条形指定视觉位移,可以获得分组条形图。
dodge() 函数为每个条形图引入一个相对偏移量,从而实现组的视觉效果。在以下示例中,vbar() 字形对于特定月份的每一组条形图的偏移量为 0.25。
from bokeh.plotting import figure, output_file, show
from bokeh.transform import dodge
products = ['computer','mobile','printer']
months = ['Jan','Feb','Mar']
sales = {'products':products,
   'Jan':[10,40,5],
   'Feb':[8,45,10],
   'Mar':[25,60,22]}
fig = figure(x_range = products, plot_width = 300, plot_height = 300)
fig.vbar(x = dodge('products', -0.25, range = fig.x_range), top = 'Jan',
   width = 0.2,source = sales, color = "red")
fig.vbar(x = dodge('products', 0.0, range = fig.x_range), top = 'Feb',
   width = 0.2, source = sales,color = "green")
fig.vbar(x = dodge('products', 0.25, range = fig.x_range), top = 'Mar',
   width = 0.2,source = sales,color = "blue")
show(fig)
输出
对数刻度轴
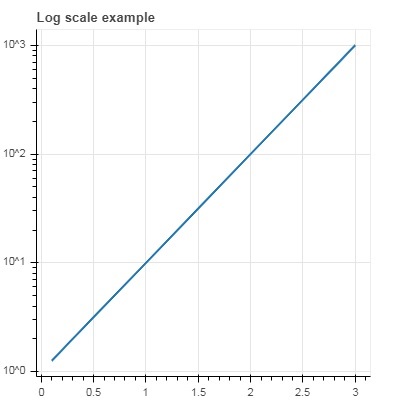
当绘图一个轴上的值随另一个轴的线性递增值呈指数增长时,通常需要将前一个轴上的数据显示在对数刻度上。例如,如果 x 和 y 数据序列之间存在幂律关系,则最好在两个轴上都使用对数刻度。
Bokeh.plotting API 的 figure() 函数接受 x_axis_type 和 y_axis_type 作为参数,可以通过为这两个参数中的任何一个的值传递“log”来将其指定为对数轴。
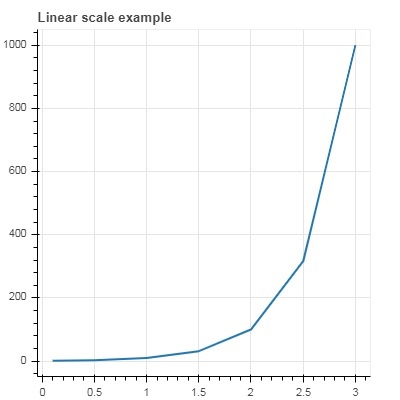
第一个图显示了 x 和 10x 之间的线性刻度图。在第二个图中,y_axis_type 设置为 'log'。
from bokeh.plotting import figure, output_file, show
x = [0.1, 0.5, 1.0, 1.5, 2.0, 2.5, 3.0]
y = [10**i for i in x]
fig = figure(title = 'Linear scale example',plot_width = 400, plot_height = 400)
fig.line(x, y, line_width = 2)
show(fig)
输出
现在更改 figure() 函数以配置 y_axis_type='log'。
fig = figure(title = 'Linear scale example',plot_width = 400, plot_height = 400, y_axis_type = "log")
输出
双轴
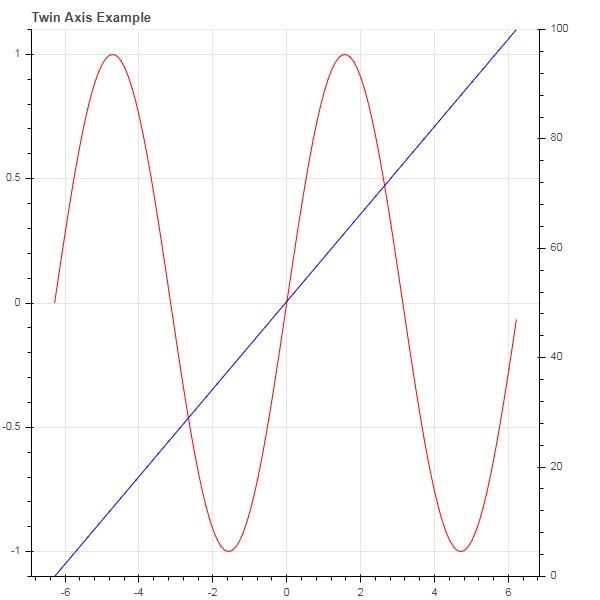
在某些情况下,可能需要显示多个轴,这些轴在一个绘图图形上表示不同的范围。可以通过定义extra_x_range 和extra_y_range 属性来配置图形对象。向图形添加新字形时,将使用这些命名范围。
我们尝试在同一图中显示正弦曲线和直线。两个字形的 y 轴范围不同。正弦曲线和直线的 x 和 y 数据序列如下所示:
from numpy import pi, arange, sin, linspace
x = arange(-2*pi, 2*pi, 0.1)
y = sin(x)
y2 = linspace(0, 100, len(y))
此处,x 和 y 之间的图表示正弦关系,x 和 y2 之间的图是一条直线。Figure 对象定义了显式的 y_range,并添加了一个表示正弦曲线的线字形,如下所示:
fig = figure(title = 'Twin Axis Example', y_range = (-1.1, 1.1))
fig.line(x, y, color = "red")
我们需要一个额外的 y 范围。它定义如下:
fig.extra_y_ranges = {"y2": Range1d(start = 0, end = 100)}
要在右侧添加额外的 y 轴,请使用 add_layout() 方法。向图形添加一个表示 x 和 y2 的新线字形。
fig.add_layout(LinearAxis(y_range_name = "y2"), 'right')
fig.line(x, y2, color = "blue", y_range_name = "y2")
这将生成一个带有双 y 轴的图。完整的代码和输出如下:
from numpy import pi, arange, sin, linspace
x = arange(-2*pi, 2*pi, 0.1)
y = sin(x)
y2 = linspace(0, 100, len(y))
from bokeh.plotting import output_file, figure, show
from bokeh.models import LinearAxis, Range1d
fig = figure(title='Twin Axis Example', y_range = (-1.1, 1.1))
fig.line(x, y, color = "red")
fig.extra_y_ranges = {"y2": Range1d(start = 0, end = 100)}
fig.add_layout(LinearAxis(y_range_name = "y2"), 'right')
fig.line(x, y2, color = "blue", y_range_name = "y2")
show(fig)
输出
Bokeh - 注释和图例
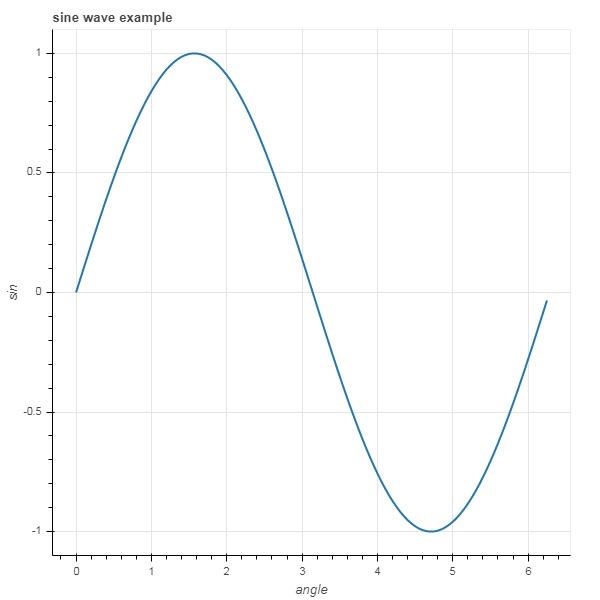
注释是在图表中添加的解释性文本。可以通过指定绘图标题、x 轴和 y 轴的标签以及在绘图区域的任何位置插入文本标签来注释 Bokeh 绘图。
绘图标题以及 x 轴和 y 轴标签可以在 Figure 构造函数本身中提供。
fig = figure(title, x_axis_label, y_axis_label)
在下面的绘图中,这些属性设置如下:
from bokeh.plotting import figure, output_file, show
import numpy as np
import math
x = np.arange(0, math.pi*2, 0.05)
y = np.sin(x)
fig = figure(title = "sine wave example", x_axis_label = 'angle', y_axis_label = 'sin')
fig.line(x, y,line_width = 2)
show(p)
输出
标题文本和轴标签也可以通过为图形对象的相应属性分配适当的字符串值来指定。
fig.title.text = "sine wave example"
fig.xaxis.axis_label = 'angle'
fig.yaxis.axis_label = 'sin'
还可以指定标题的位置、对齐方式、字体和颜色。
fig.title.align = "right"
fig.title.text_color = "orange"
fig.title.text_font_size = "25px"
fig.title.background_fill_color = "blue"
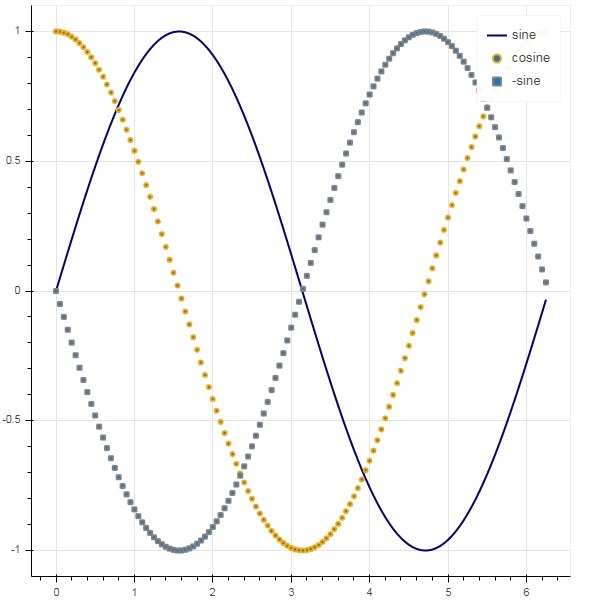
向绘图图形添加图例非常容易。我们必须使用任何字形方法的 legend 属性。
下面我们在绘图中用三个不同的图例显示了三条字形曲线:
from bokeh.plotting import figure, output_file, show
import numpy as np
import math
x = np.arange(0, math.pi*2, 0.05)
fig = figure()
fig.line(x, np.sin(x),line_width = 2, line_color = 'navy', legend = 'sine')
fig.circle(x,np.cos(x), line_width = 2, line_color = 'orange', legend = 'cosine')
fig.square(x,-np.sin(x),line_width = 2, line_color = 'grey', legend = '-sine')
show(fig)
输出
Bokeh - Pandas
在以上所有示例中,要绘制的数据都是以 Python 列表或 numpy 数组的形式提供的。也可以以 pandas DataFrame 对象的形式提供数据源。
DataFrame 是一种二维数据结构。数据框中的列可以具有不同的数据类型。Pandas 库具有从各种来源(例如 CSV 文件、Excel 工作表、SQL 表等)创建数据框的函数。
为了以下示例的目的,我们使用一个包含两列的 CSV 文件,这两列分别表示数字 x 和 10x。test.csv 文件如下所示:
x,pow
0.0,1.0
0.5263157894736842,3.3598182862837818
1.0526315789473684,11.28837891684689
1.5789473684210527,37.926901907322495
2.1052631578947367,127.42749857031335
2.631578947368421,428.1332398719391
3.1578947368421053,1438.449888287663
3.6842105263157894,4832.930238571752
4.2105263157894735,16237.76739188721
4.7368421052631575,54555.947811685146
我们将使用 pandas 中的 read_csv() 函数将此文件读取到数据框对象中。
import pandas as pd
df = pd.read_csv('test.csv')
print (df)
数据框如下所示:
x        pow
0 0.000000 1.000000
1 0.526316 3.359818
2 1.052632 11.288379
3 1.578947 37.926902
4 2.105263 127.427499
5 2.631579 428.133240
6 3.157895 1438.449888
7 3.684211 4832.930239
8 4.210526 16237.767392
9 4.736842 54555.947812
“x”和“pow”列用作 bokeh 绘图图形中线字形的数列。
from bokeh.plotting import figure, output_file, show
p = figure()
x = df['x']
y = df['pow']
p.line(x,y,line_width = 2)
p.circle(x, y,size = 20)
show(p)
输出

Bokeh - ColumnDataSource
Bokeh API 中的大多数绘图方法能够通过 ColumnDatasource 对象接收数据源参数。它使得绘图和“数据表”之间可以共享数据。
ColumnDatasource 可以被认为是列名和数据列表之间的映射。将具有一个或多个字符串键和列表或 numpy 数组作为值的 Python dict 对象传递给 ColumnDataSource 构造函数。
示例
以下是一个示例
from bokeh.models import ColumnDataSource
data = {'x':[1, 4, 3, 2, 5],
   'y':[6, 5, 2, 4, 7]}
cds = ColumnDataSource(data = data)
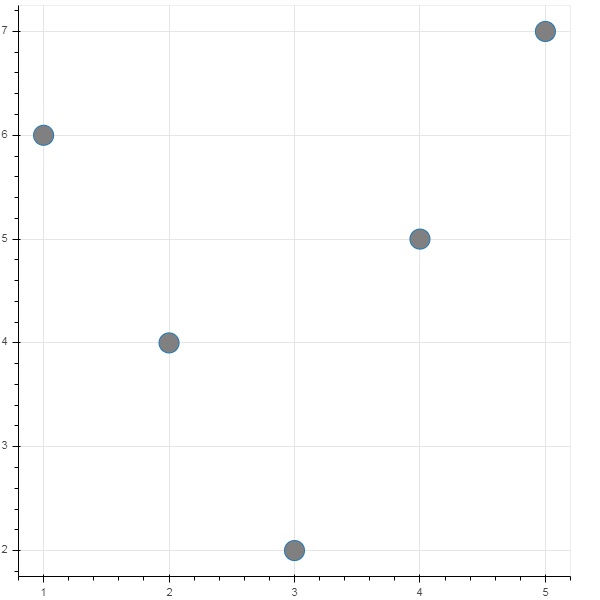
然后,此对象用作字形方法中 source 属性的值。以下代码使用 ColumnDataSource 生成散点图。
from bokeh.plotting import figure, output_file, show
from bokeh.models import ColumnDataSource
data = {'x':[1, 4, 3, 2, 5],
   'y':[6, 5, 2, 4, 7]}
cds = ColumnDataSource(data = data)
fig = figure()
fig.scatter(x = 'x', y = 'y',source = cds, marker = "circle", size = 20, fill_color = "grey")
show(fig)
输出
无需将 Python 字典分配给 ColumnDataSource,我们可以使用 Pandas DataFrame 来代替。
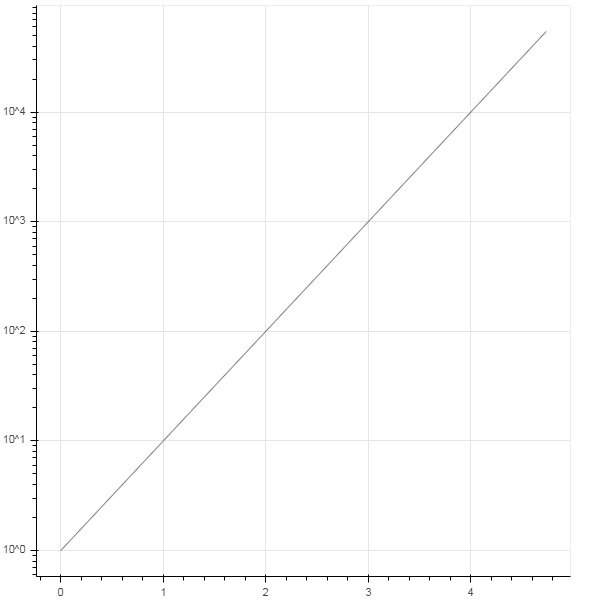
让我们使用“test.csv”(在本节前面使用过)来获取 DataFrame,并使用它来获取 ColumnDataSource 并渲染线图。
from bokeh.plotting import figure, output_file, show
import pandas as pd
from bokeh.models import ColumnDataSource
df = pd.read_csv('test.csv')
cds = ColumnDataSource(df)
fig = figure(y_axis_type = 'log')
fig.line(x = 'x', y = 'pow',source = cds, line_color = "grey")
show(fig)
输出
Bokeh - 数据过滤
通常,您可能希望获得与满足某些条件的数据的一部分相关的绘图,而不是整个数据集。bokeh.models 模块中定义的 CDSView 类对象通过对 ColumnDatasource 应用一个或多个过滤器来返回正在考虑的子集。
IndexFilter 是最简单的过滤器类型。您必须指定只想在绘制图形时使用的数据集中的行的索引。
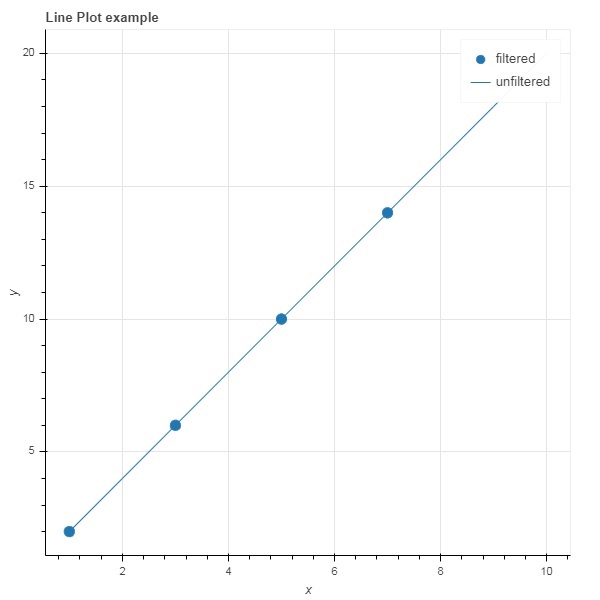
以下示例演示了使用 IndexFilter 设置 CDSView 的方法。生成的图形显示了 ColumnDataSource 的 x 和 y 数据序列之间的线字形。通过对它应用索引过滤器来获得视图对象。由于 IndexFilter 的结果,该视图用于绘制圆形字形。
示例
from bokeh.models import ColumnDataSource, CDSView, IndexFilter
from bokeh.plotting import figure, output_file, show
source = ColumnDataSource(data = dict(x = list(range(1,11)), y = list(range(2,22,2))))
view = CDSView(source=source, filters = [IndexFilter([0, 2, 4,6])])
fig = figure(title = 'Line Plot example', x_axis_label = 'x', y_axis_label = 'y')
fig.circle(x = "x", y = "y", size = 10, source = source, view = view, legend = 'filtered')
fig.line(source.data['x'],source.data['y'], legend = 'unfiltered')
show(fig)
输出
要仅选择满足特定布尔条件的数据源中的那些行,请应用 BooleanFilter。
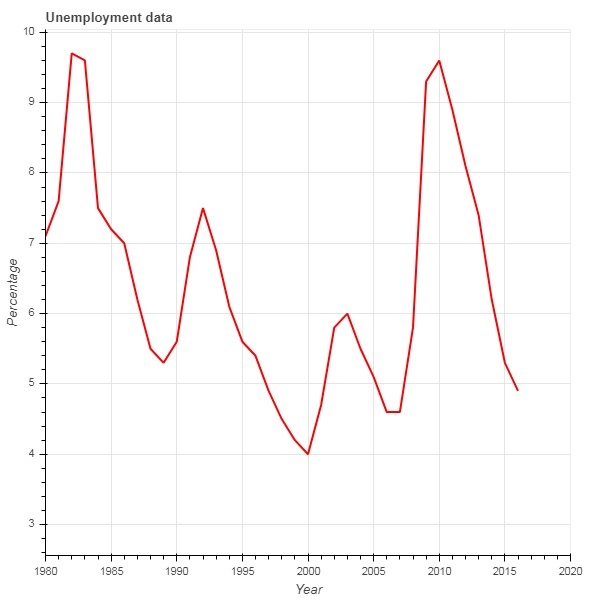
典型的 Bokeh 安装包含 sampledata 目录中的一些示例数据集。在下面的示例中,我们使用以 unemployment1948.csv 形式提供的 **unemployment1948** 数据集。它存储的是自 1948 年以来美国每年失业率的百分比。我们只想生成 1980 年及以后年份的图表。为此,通过对给定数据源应用 BooleanFilter 来获得 CDSView 对象。
from bokeh.models import ColumnDataSource, CDSView, BooleanFilter
from bokeh.plotting import figure, show
from bokeh.sampledata.unemployment1948 import data
source = ColumnDataSource(data)
booleans = [True if int(year) >= 1980 else False for year in
source.data['Year']]
print (booleans)
view1 = CDSView(source = source, filters=[BooleanFilter(booleans)])
p = figure(title = "Unemployment data", x_range = (1980,2020), x_axis_label = 'Year', y_axis_label='Percentage')
p.line(x = 'Year', y = 'Annual', source = source, view = view1, color = 'red', line_width = 2)
show(p)
输出
为了在应用过滤器时增加灵活性,Bokeh 提供了一个 CustomJSFilter 类,借助它可以使用用户定义的 JavaScript 函数过滤数据源。
下面的示例使用相同的美 国失业数据。定义一个 CustomJSFilter 来绘制 1980 年及以后的失业数据。
from bokeh.models import ColumnDataSource, CDSView, CustomJSFilter
from bokeh.plotting import figure, show
from bokeh.sampledata.unemployment1948 import data
source = ColumnDataSource(data)
custom_filter = CustomJSFilter(code = '''
   var indices = [];

   for (var i = 0; i < source.get_length(); i++){
      if (parseInt(source.data['Year'][i]) > = 1980){
         indices.push(true);
      } else {
         indices.push(false);
      }
   }
   return indices;
''')
view1 = CDSView(source = source, filters = [custom_filter])
p = figure(title = "Unemployment data", x_range = (1980,2020), x_axis_label = 'Year', y_axis_label = 'Percentage')
p.line(x = 'Year', y = 'Annual', source = source, view = view1, color = 'red', line_width = 2)
show(p)
Bokeh - 布局
Bokeh 可视化可以适当地安排在不同的布局选项中。这些布局以及大小模式使得图表和小部件可以根据浏览器窗口的大小自动调整大小。为了保持一致的外观,布局中的所有项目必须具有相同的大小模式。小部件(按钮、菜单等)放在单独的小部件框中,而不是图表图形中。
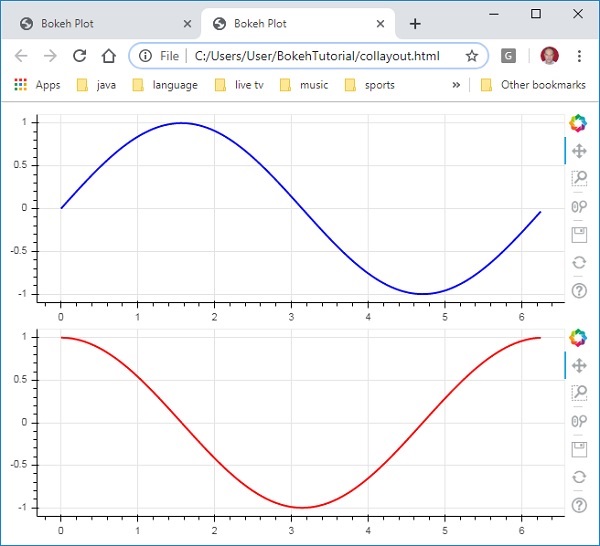
第一种布局是列布局,它垂直显示图表图形。**column() 函数**定义在 **bokeh.layouts** 模块中,并采用以下签名:
from bokeh.layouts import column
col = column(children, sizing_mode)
**children** − 图表和/或小部件的列表。
**sizing_mode** − 确定布局中项目的调整大小方式。可能的值为“fixed”、“stretch_both”、“scale_width”、“scale_height”、“scale_both”。默认值为“fixed”。
以下代码生成两个 Bokeh 图形并将它们放在列布局中,以便它们垂直显示。每个图形中都显示表示 x 和 y 数据序列之间正弦和余弦关系的线形符号。
from bokeh.plotting import figure, output_file, show
from bokeh.layouts import column
import numpy as np
import math
x = np.arange(0, math.pi*2, 0.05)
y1 = np.sin(x)
y2 = np.cos(x)
fig1 = figure(plot_width = 200, plot_height = 200)
fig1.line(x, y1,line_width = 2, line_color = 'blue')
fig2 = figure(plot_width = 200, plot_height = 200)
fig2.line(x, y2,line_width = 2, line_color = 'red')
c = column(children = [fig1, fig2], sizing_mode = 'stretch_both')
show(c)
输出
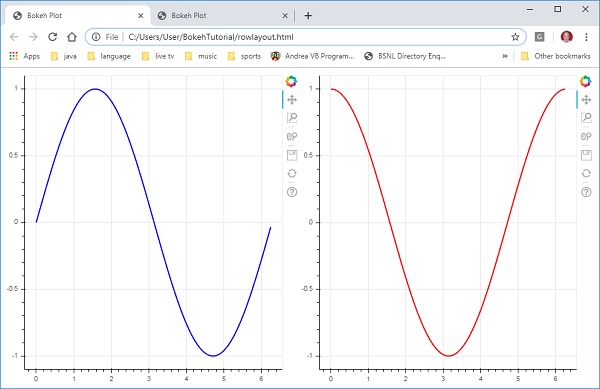
类似地,行布局水平排列图表,为此使用 **bokeh.layouts** 模块中定义的 **row() 函数**。正如您所想,它也接受两个参数(类似于 **column() 函数**)——children 和 sizing_mode。
上图中垂直显示的正弦和余弦曲线现在使用以下代码在行布局中水平显示。
from bokeh.plotting import figure, output_file, show
from bokeh.layouts import row
import numpy as np
import math
x = np.arange(0, math.pi*2, 0.05)
y1 = np.sin(x)
y2 = np.cos(x)
fig1 = figure(plot_width = 200, plot_height = 200)
fig1.line(x, y1,line_width = 2, line_color = 'blue')
fig2 = figure(plot_width = 200, plot_height = 200)
fig2.line(x, y2,line_width = 2, line_color = 'red')
r = row(children = [fig1, fig2], sizing_mode = 'stretch_both')
show(r)
输出
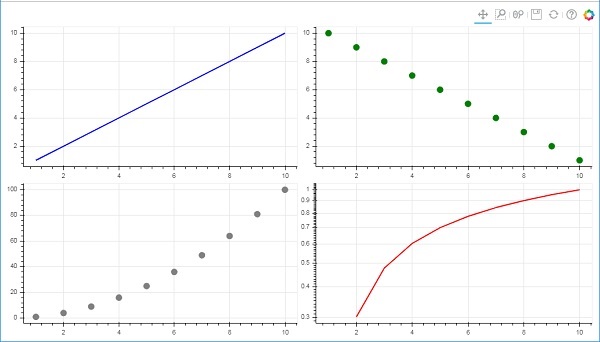
Bokeh 包还具有网格布局。它在一个二维网格的行和列中容纳多个图表图形(以及小部件)。**bokeh.layouts** 模块中的 **gridplot() 函数**返回一个网格和一个单一的统一工具栏,可以使用 toolbar_location 属性对其进行定位。
这与行或列布局不同,在行或列布局中,每个图表都显示自己的工具栏。grid() 函数也使用 children 和 sizing_mode 参数,其中 children 是一个列表的列表。确保每个子列表的维度相同。
在下面的代码中,四个不同的 x 和 y 数据序列之间的关系绘制在一个两行两列的网格中。
from bokeh.plotting import figure, output_file, show
from bokeh.layouts import gridplot
import math
x = list(range(1,11))

y1 = x
y2 =[11-i for i in x]
y3 = [i*i for i in x]
y4 = [math.log10(i) for i in x]

fig1 = figure(plot_width = 200, plot_height = 200)
fig1.line(x, y1,line_width = 2, line_color = 'blue')
fig2 = figure(plot_width = 200, plot_height = 200)
fig2.circle(x, y2,size = 10, color = 'green')
fig3 = figure(plot_width = 200, plot_height = 200)
fig3.circle(x,y3, size = 10, color = 'grey')
fig4 = figure(plot_width = 200, plot_height = 200, y_axis_type = 'log')
fig4.line(x,y4, line_width = 2, line_color = 'red')
grid = gridplot(children = [[fig1, fig2], [fig3,fig4]], sizing_mode = 'stretch_both')
show(grid)
输出
Bokeh - 绘图工具
渲染 Bokeh 图表时,通常会在图形的右侧显示一个工具栏。它包含一组默认工具。首先,可以通过 figure() 函数中的 toolbar_location 属性配置工具栏的位置。此属性可以取以下值之一:
- “above”
- “below”
- “left”
- “right”
- “None”
例如,以下语句将导致工具栏显示在图表的下方:
Fig = figure(toolbar_location = "below")
可以通过根据需要添加 bokeh.models 模块中定义的各种工具来配置此工具栏。例如:
Fig.add_tools(WheelZoomTool())
这些工具可以分为以下几类:
- 平移/拖动工具
- 单击/点击工具
- 滚动/捏合工具
| 工具 | 描述 | 图标 |
|---|---|---|
BoxSelectTool 名称:'box_select' |
允许用户通过左键拖动鼠标来定义矩形选择区域。 |  |
LassoSelectTool 名称:'lasso_select' |
允许用户通过左键拖动鼠标来定义任意选择区域。 |  |
PanTool 名称:'pan', 'xpan', 'ypan', |
允许用户通过左键拖动鼠标来平移图表。 |  |
TapTool 名称:'tap' |
允许用户通过单击左键来选择单个点。 |  |
WheelZoomTool 名称:'wheel_zoom', 'xwheel_zoom', 'ywheel_zoom' |
放大或缩小图表,以当前鼠标位置为中心。 |  |
WheelPanTool 名称:'xwheel_pan', 'ywheel_pan' |
沿指定维度平移图表窗口,而不会改变窗口的纵横比。 |  |
ResetTool 名称:'reset' |
将图表范围恢复到原始值。 |  |
SaveTool 名称:'save' |
允许用户保存图表的 PNG 图片。 |  |
ZoomInTool 名称:'zoom_in', 'xzoom_in', 'yzoom_in' |
放大工具将放大 x、y 或两个坐标的图表。 |  |
ZoomOutTool 名称:'zoom_out', 'xzoom_out', 'yzoom_out' |
缩小工具将缩小 x、y 或两个坐标的图表。 |  |
CrosshairTool 名称:'crosshair' |
在图表上绘制十字准线注释,以当前鼠标位置为中心。 |  |
Bokeh - 样式视觉属性
可以通过将各种属性设置为所需的值来自定义 Bokeh 图表的默认外观。这些属性主要分为三种类型:
线条属性
下表列出了与线形符号相关的各种属性。
| 1 | line_color | 用于绘制线条的颜色。 |
| 2 | line_width | 以像素为单位的线宽。 |
| 3 | line_alpha | 介于 0(透明)和 1(不透明)之间的浮点数。 |
| 4 | line_join | 如何连接路径段。定义的值为:“miter”(miter_join)、“round”(round_join)、“bevel”(bevel_join)。 |
| 5 | line_cap | 如何终止路径段。定义的值为:“butt”(butt_cap)、“round”(round_cap)、“square”(square_cap)。 |
| 6 | line_dash | 用于线型的样式。定义的值为:“solid”、“dashed”、“dotted”、“dotdash”、“dashdot”。 |
| 7 | line_dash_offset | 图案应从线划线中开始的距离(以像素为单位)。 |
填充属性
下面列出了各种填充属性:
| 1 | fill_color | 用于填充路径的颜色。 |
| 2 | fill_alpha | 介于 0(透明)和 1(不透明)之间的浮点数。 |
文本属性
下表列出了许多与文本相关的属性:
| 1 | text_font | 字体名称,例如“times”、“helvetica”。 |
| 2 | text_font_size | 以 px、em 或 pt 为单位的字体大小,例如“12pt”、“1.5em”。 |
| 3 | text_font_style | 要使用的字体样式:“normal”、“italic”、“bold”。 |
| 4 | text_color | 用于渲染文本的颜色。 |
| 5 | text_alpha | 介于 0(透明)和 1(不透明)之间的浮点数。 |
| 6 | text_align | 文本的水平锚点 - “left”、“right”、“center”。 |
| 7 | text_baseline | 文本的垂直锚点 - “top”、“middle”、“bottom”、“alphabetic”、“hanging”。 |
Bokeh - 自定义图例
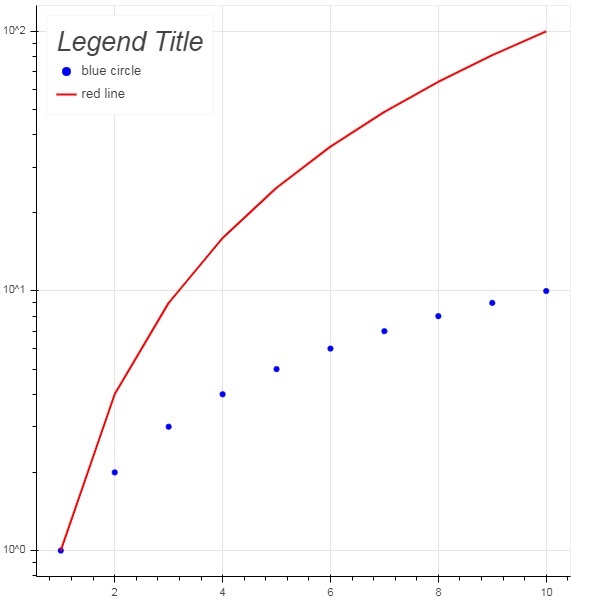
图表中的各种符号可以通过图例属性来识别,图例默认情况下显示为图表区域右上角的标签。可以使用以下属性来自定义此图例:
| 1 | legend.label_text_font | 将默认标签字体更改为指定的字体名称。 | |
| 2 | legend.label_text_font_size | 以磅为单位的字体大小。 | |
| 3 | legend.location | 在指定位置设置标签。 | |
| 4 | legend.title | 设置图例标签的标题。 | |
| 5 | legend.orientation | 设置为水平(默认)或垂直。 | |
| 6 | legend.clicking_policy | 指定单击图例时应该发生什么:hide:隐藏与图例对应的符号;mute:静音与图例对应的符号。 |
示例
图例自定义的示例代码如下:
from bokeh.plotting import figure, output_file, show
import math
x2 = list(range(1,11))
y4 = [math.pow(i,2) for i in x2]
y2 = [math.log10(pow(10,i)) for i in x2]
fig = figure(y_axis_type = 'log')
fig.circle(x2, y2,size = 5, color = 'blue', legend = 'blue circle')
fig.line(x2,y4, line_width = 2, line_color = 'red', legend = 'red line')
fig.legend.location = 'top_left'
fig.legend.title = 'Legend Title'
fig.legend.title_text_font = 'Arial'
fig.legend.title_text_font_size = '20pt'
show(fig)
输出
Bokeh - 添加小部件
bokeh.models.widgets 模块包含类似于 HTML 表单元素的 GUI 对象的定义,例如按钮、滑块、复选框、单选按钮等。这些控件为图表提供了交互式界面。可以通过在相应的事件上执行自定义 JavaScript 函数来执行诸如修改图表数据、更改图表参数等处理。
Bokeh 允许使用两种方法定义回调功能:
使用 **CustomJS 回调**,以便交互性可以在独立的 HTML 文档中工作。
使用 **Bokeh 服务器**并设置事件处理程序。
在本节中,我们将了解如何添加 Bokeh 小部件并分配 JavaScript 回调。
按钮
此小部件是一个可单击的按钮,通常用于调用用户定义的回调处理程序。构造函数采用以下参数:
Button(label, icon, callback)
label 参数是用作按钮标题的字符串,callback 是单击时要调用的自定义 JavaScript 函数。
在下面的示例中,图表和小部件按钮显示在列布局中。图表本身呈现 x 和 y 数据序列之间的线形符号。
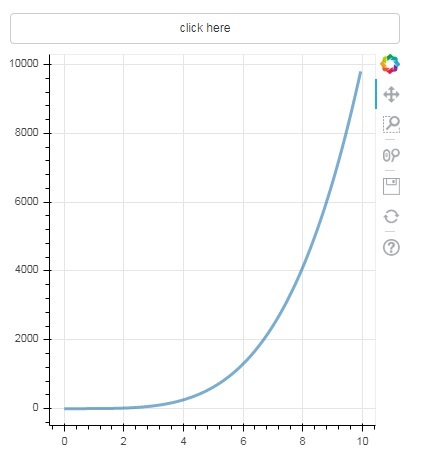
使用 **CustomJS() 函数**定义了一个名为“callback”的自定义 JavaScript 函数。它以变量 cb_obj 的形式接收触发回调的对象(在本例中为按钮)的引用。
此函数会更改源 ColumnDataSource 数据,并最终在此源数据中发出此更新。
from bokeh.layouts import column
from bokeh.models import CustomJS, ColumnDataSource
from bokeh.plotting import Figure, output_file, show
from bokeh.models.widgets import Button

x = [x*0.05 for x in range(0, 200)]
y = x

source = ColumnDataSource(data=dict(x=x, y=y))
plot = Figure(plot_width=400, plot_height=400)
plot.line('x', 'y', source=source, line_width=3, line_alpha=0.6)

callback = CustomJS(args=dict(source=source), code="""
   var data = source.data;
   x = data['x']
   y = data['y']
   for (i = 0; i < x.length; i++) {
      y[i] = Math.pow(x[i], 4)
   }
   source.change.emit();
""")

btn = Button(label="click here", callback=callback, name="1")

layout = column(btn , plot)
show(layout)
输出(初始)
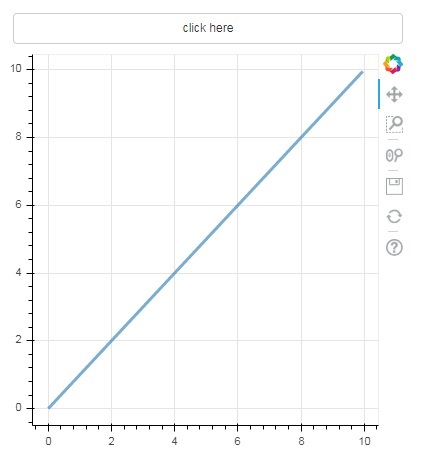
单击图表顶部的按钮,查看更新后的图表图形,如下所示:
输出(单击后)
滑块
借助滑块控件,可以选择分配给它的 start 和 end 属性之间的数字。
Slider(start, end, step, value)
在下面的示例中,我们在滑块的 on_change 事件上注册了一个回调函数。滑块的瞬时数值以 cb_obj.value 的形式提供给处理程序,该值用于修改 ColumnDatasource 数据。当您滑动位置时,图表图形会不断更新。
from bokeh.layouts import column
from bokeh.models import CustomJS, ColumnDataSource
from bokeh.plotting import Figure, output_file, show
from bokeh.models.widgets import Slider

x = [x*0.05 for x in range(0, 200)]
y = x

source = ColumnDataSource(data=dict(x=x, y=y))
plot = Figure(plot_width=400, plot_height=400)
plot.line('x', 'y', source=source, line_width=3, line_alpha=0.6)

handler = CustomJS(args=dict(source=source), code="""
   var data = source.data;
   var f = cb_obj.value
   var x = data['x']
   var y = data['y']
   for (var i = 0; i < x.length; i++) {
      y[i] = Math.pow(x[i], f)
   }
   source.change.emit();
""")

slider = Slider(start=0.0, end=5, value=1, step=.25, title="Slider Value")

slider.js_on_change('value', handler)
layout = column(slider, plot)
show(layout)
输出
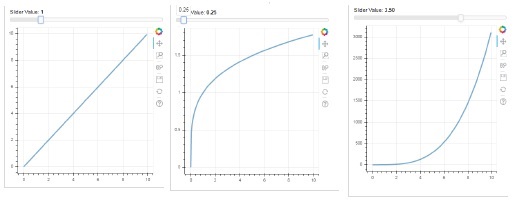
RadioGroup
此小部件显示一组互斥的切换按钮,在标题左侧显示圆形按钮。
RadioGroup(labels, active)
其中,labels 是标题列表,active 是所选项的索引。
Select
此小部件是一个简单的字符串项目下拉列表,可以选择其中一个。选定的字符串显示在顶部窗口中,它是 value 参数。
Select(options, value)
下拉列表中的字符串元素列表以 options 列表对象的格式给出。
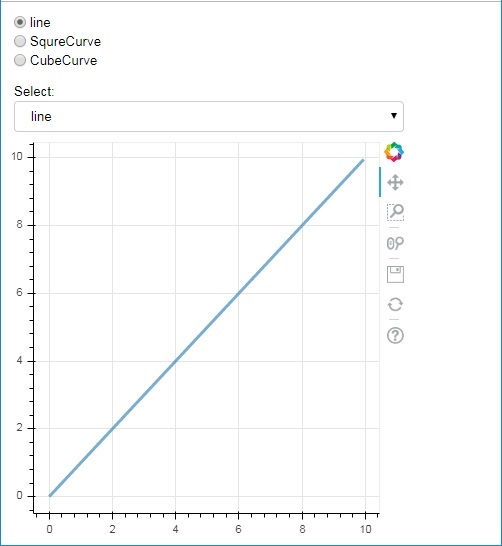
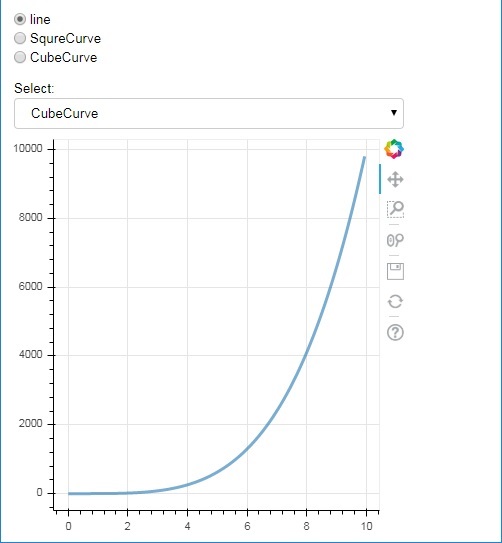
以下是一个单选按钮和小部件选择组合示例,两者都提供了 x 和 y 数据序列之间三种不同的关系。**RadioGroup** 和 **Select 小部件**分别通过 on_change() 方法与各自的处理程序注册。
from bokeh.layouts import column
from bokeh.models import CustomJS, ColumnDataSource
from bokeh.plotting import Figure, output_file, show
from bokeh.models.widgets import RadioGroup, Select

x = [x*0.05 for x in range(0, 200)]
y = x

source = ColumnDataSource(data=dict(x=x, y=y))

plot = Figure(plot_width=400, plot_height=400)
plot.line('x', 'y', source=source, line_width=3, line_alpha=0.6)

radiohandler = CustomJS(args=dict(source=source), code="""
   var data = source.data;
   console.log('Tap event occurred at x-position: ' + cb_obj.active);
   //plot.title.text=cb_obj.value;
   x = data['x']
   y = data['y']
   if (cb_obj.active==0){
      for (i = 0; i < x.length; i++) {
         y[i] = x[i];
      }
   }
   if (cb_obj.active==1){
      for (i = 0; i < x.length; i++) {
         y[i] = Math.pow(x[i], 2)
      }
   }
   if (cb_obj.active==2){
      for (i = 0; i < x.length; i++) {
         y[i] = Math.pow(x[i], 4)
      }
   }
   source.change.emit();
""")

selecthandler = CustomJS(args=dict(source=source), code="""
   var data = source.data;
   console.log('Tap event occurred at x-position: ' + cb_obj.value);
   //plot.title.text=cb_obj.value;
   x = data['x']
   y = data['y']
   if (cb_obj.value=="line"){
      for (i = 0; i < x.length; i++) {
         y[i] = x[i];
      }
   }
   if (cb_obj.value=="SquareCurve"){
      for (i = 0; i < x.length; i++) {
         y[i] = Math.pow(x[i], 2)
      }
   }
   if (cb_obj.value=="CubeCurve"){
      for (i = 0; i < x.length; i++) {
         y[i] = Math.pow(x[i], 4)
      }
   }
   source.change.emit();
""")

radio = RadioGroup(
   labels=["line", "SqureCurve", "CubeCurve"], active=0)
radio.js_on_change('active', radiohandler)
select = Select(title="Select:", value='line', options=["line", "SquareCurve", "CubeCurve"])
select.js_on_change('value', selecthandler)

layout = column(radio, select, plot)
show(layout)
输出
Tab 小部件
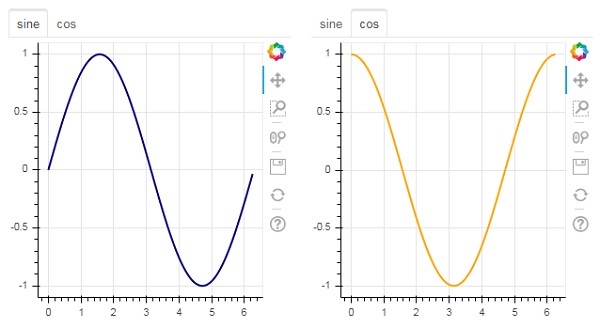
就像在浏览器中一样,每个选项卡都可以显示不同的网页,Tab 小部件是 Bokeh 模型,为每个图形提供不同的视图。在下面的示例中,正弦曲线和余弦曲线的两个图表图形渲染在两个不同的选项卡中:
from bokeh.plotting import figure, output_file, show
from bokeh.models import Panel, Tabs
import numpy as np
import math
x=np.arange(0, math.pi*2, 0.05)
fig1=figure(plot_width=300, plot_height=300)

fig1.line(x, np.sin(x),line_width=2, line_color='navy')

tab1 = Panel(child=fig1, title="sine")
fig2=figure(plot_width=300, plot_height=300)
fig2.line(x,np.cos(x), line_width=2, line_color='orange')
tab2 = Panel(child=fig2, title="cos")

tabs = Tabs(tabs=[ tab1, tab2 ])

show(tabs)
输出
Bokeh - 服务器
Bokeh 架构采用解耦设计,其中可以使用 Python 创建图表和符号等对象,并将其转换为 JSON 以供 **BokehJS 客户端库**使用。
但是,可以使用 **Bokeh 服务器**使 Python 和浏览器中的对象彼此同步。它能够响应在浏览器中生成的 UI 事件,并充分发挥 Python 的强大功能。它还有助于自动将服务器端更新推送到浏览器中的小部件或图表。
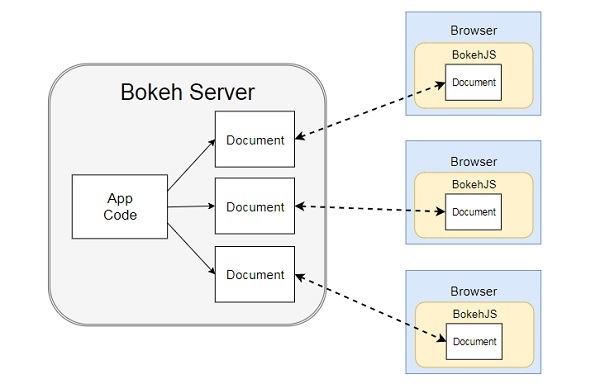
Bokeh 服务器使用用 Python 编写的应用程序代码来创建 Bokeh 文档。来自客户端浏览器的每个新连接都会导致 Bokeh 服务器为该会话创建一个新文档。
首先,我们必须开发一个要提供给客户端浏览器的应用程序代码。以下代码呈现正弦波线形符号。除了图表之外,还呈现了一个滑块控件来控制正弦波的频率。回调函数 **update_data()** 更新 **ColumnDataSource** 数据,将滑块的瞬时值作为当前频率。
import numpy as np
from bokeh.io import curdoc
from bokeh.layouts import row, column
from bokeh.models import ColumnDataSource
from bokeh.models.widgets import Slider, TextInput
from bokeh.plotting import figure
N = 200
x = np.linspace(0, 4*np.pi, N)
y = np.sin(x)
source = ColumnDataSource(data = dict(x = x, y = y))
plot = figure(plot_height = 400, plot_width = 400, title = "sine wave")
plot.line('x', 'y', source = source, line_width = 3, line_alpha = 0.6)
freq = Slider(title = "frequency", value = 1.0, start = 0.1, end = 5.1, step = 0.1)
def update_data(attrname, old, new):
   a = 1
   b = 0
   w = 0
   k = freq.value
   x = np.linspace(0, 4*np.pi, N)
   y = a*np.sin(k*x + w) + b
   source.data = dict(x = x, y = y)
freq.on_change('value', update_data)
curdoc().add_root(row(freq, plot, width = 500))
curdoc().title = "Sliders"
接下来,通过以下命令行启动 Bokeh 服务器:
Bokeh serve –show sliders.py
Bokeh 服务器启动并运行,并在 localhost:5006/sliders 上提供应用程序。控制台日志显示以下显示:
C:\Users\User>bokeh serve --show scripts\sliders.py
2019-09-29 00:21:35,855 Starting Bokeh server version 1.3.4 (running on Tornado 6.0.3)
2019-09-29 00:21:35,875 Bokeh app running at: https://:5006/sliders
2019-09-29 00:21:35,875 Starting Bokeh server with process id: 3776
2019-09-29 00:21:37,330 200 GET /sliders (::1) 699.99ms
2019-09-29 00:21:38,033 101 GET /sliders/ws?bokeh-protocol-version=1.0&bokeh-session-id=VDxLKOzI5Ppl9kDvEMRzZgDVyqnXzvDWsAO21bRCKRZZ (::1) 4.00ms
2019-09-29 00:21:38,045 WebSocket connection opened
2019-09-29 00:21:38,049 ServerConnection created
打开您常用的浏览器并输入上述地址。正弦波图将显示如下:
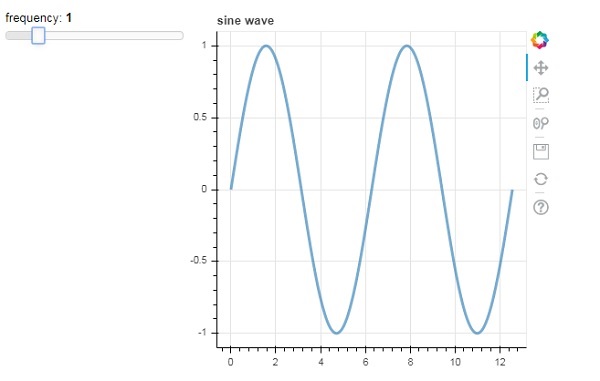
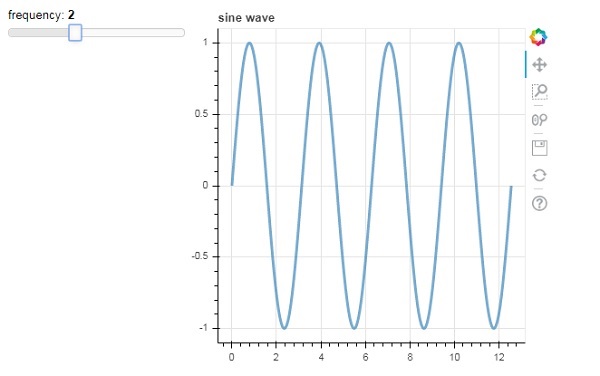
您可以尝试通过滚动滑块将频率更改为 2。
Bokeh - 使用 Bokeh 子命令
Bokeh 应用程序提供许多可在命令行执行的子命令。下表显示了这些子命令:
| 1 | Html | 为一个或多个应用程序创建 HTML 文件 |
| 2 | info | 打印 Bokeh 服务器配置信息 |
| 3 | json | 为一个或多个应用程序创建 JSON 文件 |
| 4 | png | 为一个或多个应用程序创建 PNG 文件 |
| 5 | sampledata | 下载 Bokeh 样本数据集 |
| 6 | secret | 创建用于 Bokeh 服务器的 Bokeh 密钥 |
| 7 | serve | 运行托管一个或多个应用程序的 Bokeh 服务器 |
| 8 | static | 提供 BokeJS 库使用的静态资源(JavaScript、CSS、图像、字体等) |
| 9 | svg | 为一个或多个应用程序创建 SVG 文件 |
以下命令将为包含 Bokeh 图形的 Python 脚本生成一个 HTML 文件。
C:\python37>bokeh html -o app.html app.py
添加 show 选项会自动在浏览器中打开 HTML 文件。同样,Python 脚本将使用相应的子命令转换为 PNG、SVG、JSON 文件。
要显示 Bokeh 服务器的信息,请使用 info 子命令,如下所示:
C:\python37>bokeh info
Python version : 3.7.4 (tags/v3.7.4:e09359112e, Jul 8 2019, 20:34:20) [MSC v.1916 64 bit (AMD64)]
IPython version : (not installed)
Tornado version : 6.0.3
Bokeh version : 1.3.4
BokehJS static path : c:\python37\lib\site-packages\bokeh\server\static
node.js version : (not installed)
npm version : (not installed)
为了试验各种类型的图表,Bokeh 网站 https://docs.bokeh.org.cn 提供了样本数据集。可以使用 sampledata 子命令将其下载到本地机器。
C:\python37>bokeh info
以下数据集将下载到 C:\Users\User\.bokeh\data 文件夹中:
AAPL.csv                                     airports.csv
airports.json                                CGM.csv
FB.csv                                       gapminder_fertility.csv
gapminder_life_expectancy.csv                gapminder_population.csv
gapminder_regions.csv                        GOOG.csv
haarcascade_frontalface_default.xml          IBM.csv
movies.db                                    MSFT.csv
routes.csv                                   unemployment09.csv
us_cities.json                               US_Counties.csv
world_cities.csv
WPP2012_SA_DB03_POPULATION_QUINQUENNIAL.csv
secret 子命令会生成一个密钥,该密钥将与 serve 子命令一起使用,并使用 SECRET_KEY 环境变量。
Bokeh - 导出图表
除了上面描述的子命令外,还可以使用 export() 函数将 Bokeh 图表导出为 PNG 和 SVG 文件格式。为此,本地 Python 安装应具有以下依赖库。
PhantomJS
PhantomJS 是一个 JavaScript API,它能够进行自动导航、屏幕截图、用户行为和断言。它用于运行基于浏览器的单元测试。PhantomJS 基于 WebKit,为不同的浏览器提供了类似的浏览环境,并为各种 Web 标准提供了快速且原生的支持:DOM 处理、CSS 选择器、JSON、Canvas 和 SVG。换句话说,PhantomJS 是一个没有图形用户界面的 Web 浏览器。
Pillow
Pillow(以前称为 PIL)是一个用于 Python 编程语言的免费库,它支持打开、处理和保存许多不同的图像文件格式(包括 PPM、PNG、JPEG、GIF、TIFF 和 BMP)。它的一些功能包括逐像素处理、蒙版和透明度处理、图像过滤、图像增强等。
export_png() 函数从布局生成 RGBA 格式的 PNG 图像。此函数使用 Webkit 无头浏览器在内存中呈现布局,然后捕获屏幕截图。生成的图像将与源布局具有相同的尺寸。确保 Plot.background_fill_color 和 Plot.border_fill_color 属性为 None。
from bokeh.io import export_png
export_png(plot, filename = "file.png")
可以使用诸如 Adobe Illustrator 之类的程序编辑包含 SVG 元素的 HTML5 Canvas 图表输出。SVG 对象也可以转换为 PDF。这里,canvas2svg(一个 JavaScript 库)用于模拟普通的 Canvas 元素及其方法以及 SVG 元素。与 PNG 一样,为了创建具有透明背景的 SVG,Plot.background_fill_color 和 Plot.border_fill_color 属性应设置为 None。
首先通过将 Plot.output_backend 属性设置为“svg”来激活 SVG 后端。
plot.output_backend = "svg"
对于无头导出,Bokeh 有一个实用程序函数 export_svgs()。此函数将下载布局中所有启用了 SVG 的图表作为不同的 SVG 文件。
from bokeh.io import export_svgs
plot.output_backend = "svg"
export_svgs(plot, filename = "plot.svg")
Bokeh - 嵌入图表和应用程序
可以将图表和数据(以独立文档以及 Bokeh 应用程序的形式)嵌入到 HTML 文档中。
独立文档是未由 Bokeh 服务器支持的 Bokeh 图表或文档。此类图表中的交互纯粹采用自定义 JS 的形式,而不是纯 Python 回调。
也可以嵌入由 Bokeh 服务器支持的 Bokeh 图表和文档。此类文档包含在服务器上运行的 Python 回调。
对于独立文档,可以使用 file_html() 函数获取表示 Bokeh 图表的原始 HTML 代码。
from bokeh.plotting import figure
from bokeh.resources import CDN
from bokeh.embed import file_html
fig = figure()
fig.line([1,2,3,4,5], [3,4,5,2,3])
string = file_html(plot, CDN, "my plot")
file_html() 函数的返回值可以保存为 HTML 文件,也可以用于在 Flask 应用程序中通过 URL 路由进行渲染。
对于独立文档,可以使用 json_item() 函数获取其 JSON 表示。
from bokeh.plotting import figure
from bokeh.embed import file_html
import json
fig = figure()
fig.line([1,2,3,4,5], [3,4,5,2,3])
item_text = json.dumps(json_item(fig, "myplot"))
此输出可由网页上的 Bokeh.embed.embed_item 函数使用:
item = JSON.parse(item_text);
Bokeh.embed.embed_item(item);
Bokeh 服务器上的 Bokeh 应用程序也可以嵌入,以便在每次页面加载时创建新的会话和文档,以便加载特定的现有会话。这可以使用 server_document() 函数来实现。它接受 Bokeh 服务器应用程序的 URL,并返回一个脚本,该脚本将在每次执行脚本时嵌入来自该服务器的新会话。
server_document() 函数接受 URL 参数。如果将其设置为“default”,则将使用默认 URL https://:5006/。
from bokeh.embed import server_document
script = server_document("https://:5006/sliders")
server_document() 函数返回一个如下所示的脚本标签:
<script
   src="https://:5006/sliders/autoload.js?bokeh-autoload-element=1000&bokeh-app-path=/sliders&bokeh-absolute-url=https://:5006/sliders"
   id="1000">
</script>
Bokeh - 扩展 Bokeh
Bokeh 与各种其他库很好地集成在一起,允许您为每项任务使用最合适的工具。Bokeh 生成 JavaScript 的事实使其能够将 Bokeh 输出与各种 JavaScript 库(如 PhosphorJS)结合起来。
Datashader (https://github.com/bokeh/datashader) 是另一个可以扩展 Bokeh 输出的库。它是一个 Python 库,它将大型数据集预渲染为大型栅格图像。此功能克服了浏览器在处理非常大的数据时的限制。Datashader 包括用于构建交互式 Bokeh 图表的工具,这些图表在 Bokeh 中缩放和平移时会动态重新渲染这些图像,从而可以方便地在 Web 浏览器中处理任意大型数据集。
另一个库是 Holoviews ((http://holoviews.org/)),它提供了一个简洁的声明式界面来构建 Bokeh 图表,尤其是在 Jupyter notebook 中。它有助于快速创建用于数据分析的图表原型。
Bokeh - WebGL
当必须使用大型数据集来使用 Bokeh 创建可视化效果时,交互可能会非常慢。为此,可以启用 Web Graphics Library (WebGL) 支持。
WebGL 是一个 JavaScript API,它使用 GPU(图形处理单元)在浏览器中渲染内容。此标准化插件可在所有现代浏览器中使用。
要启用 WebGL,您只需将 Bokeh 图形对象的 output_backend 属性设置为“webgl”。
fig = figure(output_backend="webgl")
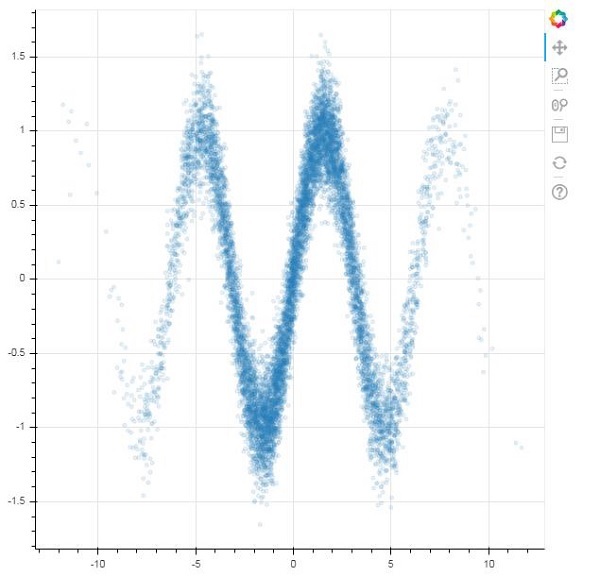
在以下示例中,我们使用 WebGL 支持绘制包含 10,000 个点的 **散点图符**。
import numpy as np
from bokeh.plotting import figure, show, output_file
N = 10000
x = np.random.normal(0, np.pi, N)
y = np.sin(x) + np.random.normal(0, 0.2, N)
output_file("scatterWebGL.html")
p = figure(output_backend="webgl")
p.scatter(x, y, alpha=0.1)
show(p)
输出
Bokeh - 使用 JavaScript 开发
Bokeh Python 库以及其他语言(如 R、Scala 和 Julia)的库主要在高级别与 BokehJS 交互。Python 程序员不必担心 JavaScript 或 Web 开发。但是,可以使用 BokehJS API 直接使用 BokehJS 进行纯 JavaScript 开发。
BokehJS 对象(如图符和小部件)的构建方式与 Bokeh Python API 中的构建方式大致相同。通常,任何 Python ClassName 都可以作为 JavaScript 中的 **Bokeh.ClassName** 获得。例如,在 Python 中获得的 Range1d 对象。
xrange = Range1d(start=-0.5, end=20.5)
它在 BokehJS 中等效地获得为:
var xrange = new Bokeh.Range1d({ start: -0.5, end: 20.5 });
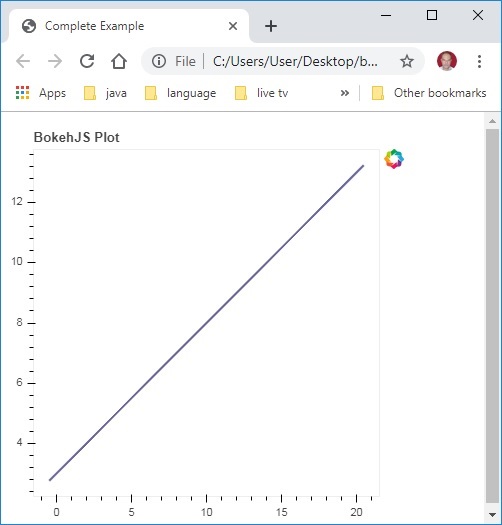
以下 JavaScript 代码嵌入到 HTML 文件中后,将在浏览器中呈现简单的线图。
首先在网页的 <head>..</head> 部分包含所有 BokehJS 库,如下所示
<head>
<script type="text/javascript" src="https://cdn.pydata.org/bokeh/release/bokeh-1.3.4.min.js"></script>
<script type="text/javascript" src="https://cdn.pydata.org/bokeh/release/bokeh-widgets-1.3.4.min.js"></script>
<script type="text/javascript" src="https://cdn.pydata.org/bokeh/release/bokeh-tables-1.3.4.min.js"></script>
<script type="text/javascript" src="https://cdn.pydata.org/bokeh/release/bokeh-gl-1.3.4.min.js"></script>
<script type="text/javascript" src="https://cdn.pydata.org/bokeh/release/bokeh-api-1.3.4.min.js"></script>
<script type="text/javascript" src="https://cdn.pydata.org/bokeh/release/bokeh-api-1.3.4.min.js"></script>
</head>
在主体部分,以下 JavaScript 代码片段构建 Bokeh 图表的各个部分。
<script>
// create some data and a ColumnDataSource
var x = Bokeh.LinAlg.linspace(-0.5, 20.5, 10);
var y = x.map(function (v) { return v * 0.5 + 3.0; });
var source = new Bokeh.ColumnDataSource({ data: { x: x, y: y } });
// make the plot
var plot = new Bokeh.Plot({
   title: "BokehJS Plot",
   plot_width: 400,
   plot_height: 400
});

// add axes to the plot
var xaxis = new Bokeh.LinearAxis({ axis_line_color: null });
var yaxis = new Bokeh.LinearAxis({ axis_line_color: null });
plot.add_layout(xaxis, "below");
plot.add_layout(yaxis, "left");

// add a Line glyph
var line = new Bokeh.Line({
   x: { field: "x" },
   y: { field: "y" },
   line_color: "#666699",
   line_width: 2
});
plot.add_glyph(line, source);

Bokeh.Plotting.show(plot);
</script>
将上述代码保存为网页,然后在您选择的浏览器中打开它。
