
 数据结构
数据结构 网络
网络 关系数据库管理系统 (RDBMS)
 操作系统
操作系统 Java
Java iOS
iOS HTML
HTML CSS
CSS Android
 Python
 C 编程
C 编程 C++
C++ C#
C# MongoDB
 MySQL
MySQL Javascript
 PHP
PHP如何在 Python 中使用 Bokeh 在图表上可视化多种形状?
Bokeh 是一个用于数据可视化的 Python 包。它是一个开源项目。Bokeh 使用 HTML 和 JavaScript 渲染其图表。这表明它在使用基于 Web 的仪表板时非常有用。
Bokeh 将数据源转换为 JSON 文件。此文件用作 BokehJS 的输入,BokehJS 是一个 JavaScript 库。这个 BokehJS是用TypeScript编写的,有助于在现代浏览器上渲染可视化效果。
Matplotlib 和 Seaborn 生成静态图表,而 Bokeh 生成交互式图表。这意味着当用户与这些图表交互时,它们会相应地改变。
图表可以嵌入为 Flask 或 Django 启用 Web 应用程序的输出。Jupyter notebook 也可用于渲染这些图表。
Bokeh 的依赖项:
Numpy
Pillow
Jinja2
Packaging
Pyyaml
Six
Tornado
Python−dateutil
在 Windows 命令提示符下安装 Bokeh
pip3 install bokeh
在 Anaconda 提示符下安装 Bokeh
conda install bokeh
以下是一个示例:
From bokeh.plotting import figure, output_file, show
示例
my_fig = figure(plot_width = 400, plot_height = 300)
my_fig.rect(x = 11,y = 11,width = 150, height = 75, width_units = 'screen', height_units = 'screen')
my_fig.square(x = 2,y = 3,size = 80, color = 'blue')
my_fig.ellipse(x = 7,y = 6, width = 30, height = 10, fill_color = None, line_width = 2)
my_fig.oval(x = 6,y = 6,width = 2, height = 1, angle = -0.4)
show(my_fig)
输出
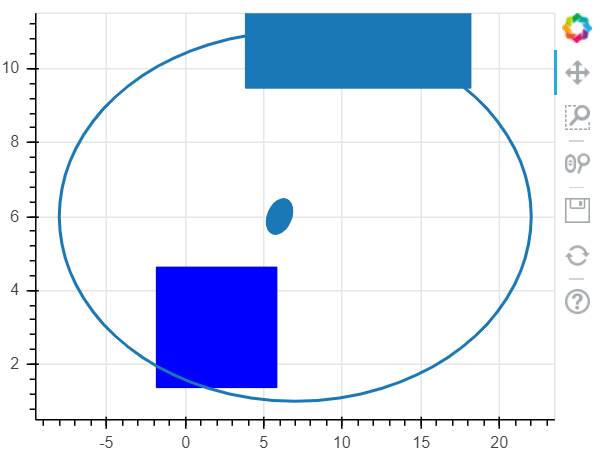
解释
导入并为所需的包设置别名。
调用 figure 函数以及图表宽度和高度。
调用 'output_file' 函数来指定将生成的 html 文件的名称。
调用 Bokeh 中的 'rect'、'square'、'ellipse' 和 'oval' 函数以及数据。
使用 'show' 函数显示图表。

更新于:2021年1月18日
131 次查看

广告