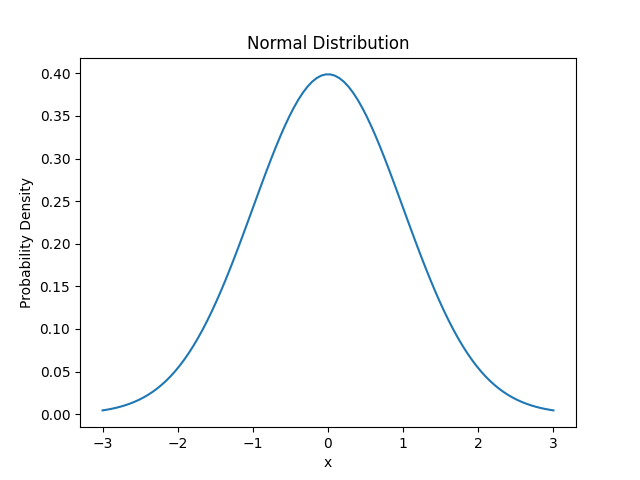
使用 Python 展示统计学中的正态分布
在问题陈述中,我们需要使用 Python 及其库来展示正态分布。在本教程中,我们将讨论什么是正态分布以及如何使用 Python 绘制它。
什么是统计学中的正态分布?
在统计学中,正态分布是一种流行的概率分布。它经常作为自然发生的事件的模型,其不同的特征是钟形曲线。它也称为高斯分布。
我们可以使用 Python 中的随机函数创建符合正态分布的随机数据点以显示 ND。之后,可以使用获得数据的直方图来显示钟形曲线。

上述问题的逻辑
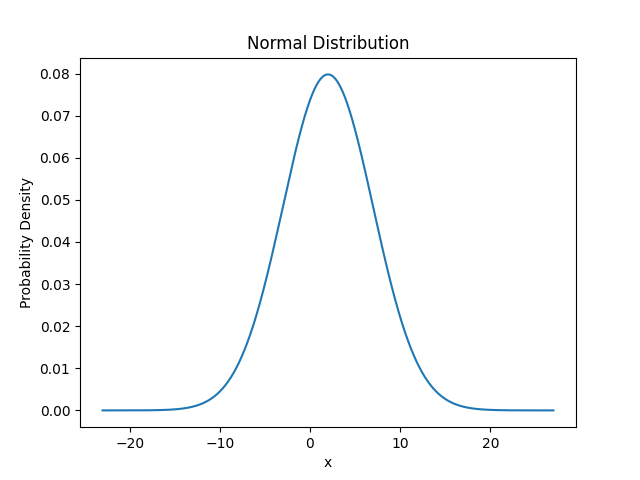
为了解决给定的问题并使用 Python 展示正态分布,我们将使用 Python 库,如 Numpy、Matplotlib 和 scipy.stats。这些库将使我们的任务变得简单,并且我们将能够轻松地展示正态分布。我们必须设置均值和标准差的值。然后计算概率密度函数并生成 x 和 y 的坐标。并使用 matplotlib 绘制直方图。
算法
步骤 1 - 首先导入 Python 的必要库。在我们的例子中,我们导入 Numpy、Matplotlib 和 Scipy 库来演示正态分布。
import numpy as nmp
import matplotlib.pyplot as mt_plt
from scipy.stats import norm
步骤 2 - 接下来,初始化均值和标准差的值。
mean = 2
std_dev = 5
步骤 3 - 现在我们将使用 linspace 生成 x 坐标的值。
x = nmp.linspace(mean - 5 * std_dev, mean + 5 * std_dev, 1000)
步骤 4 - 获取 x 值后,我们将使用正态分布的概率密度函数生成 y 坐标值。
y = norm.pdf(x, mean, std_dev)
步骤 5 - 现在我们将使用 plot() 函数绘制钟形曲线。
mt_plt.plot(x, y)
步骤 6 - 然后我们将绘制窗口并为 x 轴和 y 轴提供标签。并使用 show() 方法显示曲线。
# Plot the window and define the labels
mt_plt.xlabel('x')
mt_plt.ylabel('Probability Density')
mt_plt.title('Normal Distribution')

# Show the plot
mt_plt.show()
示例
import numpy as nmp
import matplotlib.pyplot as mt_plt
from scipy.stats import norm

# Set the values of mean and standard deviation
mean = 2
std_dev = 5

# Generate x-coordinate values
x = nmp.linspace(mean - 5 * std_dev, mean + 5 * std_dev, 1000)

# calculate the respective values of y with the help of PDF of ND
y = norm.pdf(x, mean, std_dev)

# Plot the bell-shaped curve
mt_plt.plot(x, y)

# Plot the window and define the labels
mt_plt.xlabel('x')
mt_plt.ylabel('Probability Density')
mt_plt.title('Normal Distribution')

# Show the plot
mt_plt.show()
输出

复杂度
在 Python 中显示正态分布的时间复杂度为 O(n),其中 n 是范围内的值的数量。因为我们生成了 x 的值范围,这需要 O(n) 时间,并且计算概率密度函数也需要 O(n) 时间,这是导致这种时间复杂度的主要原因。
结论
在我们的文章中,我们讨论了正态分布,并展示了该分布的演示。我们创建了使用库在 python 中显示分布的逻辑和算法,并计算了其时间复杂度。


 数据结构
数据结构 网络
网络 关系数据库管理系统
 操作系统
操作系统 Java
Java iOS
iOS HTML
HTML CSS
CSS Android
 Python
 C 语言编程
 C++
C++ C#
C# MongoDB
 MySQL
MySQL Javascript
 PHP
PHP