- SciPy 教程
- SciPy - 主页
- SciPy - 简介
- SciPy - 环境设置
- SciPy - 基本功能
- SciPy - 集群
- SciPy - 常量
- SciPy - FFTpack
- SciPy - 集成
- SciPy - 插值
- SciPy - 输入和输出
- SciPy - 线性代数
- SciPy - N 维图像
- SciPy - 优化
- SciPy - 统计
- SciPy - CSGraph
- SciPy - 空间
- SciPy - ODR
- SciPy - 特殊包
- SciPy 有用资源
- SciPy - 参考
- SciPy - 快速指南
- SciPy - 有用资源
- SciPy - 讨论
SciPy - single() 方法
SciPy single() 方法在下述矩阵中执行单/最小/最近链接任务。此方法的使用方式是定义两个集群之间的距离像两个不同点之间的最短距离。
在数据科学领域,我们使用此方法进行集群分析。它用于识别数据模式、对齐项和异常检测。
语法
以下是 SciPy single() 方法的语法 −
single(y)
参数
此函数仅接受一个参数 −
- y: 此变量作为 single() 方法的参数,用于存储数据绘制的列表数组整数。
返回值
此方法返回连接矩阵(结果)。
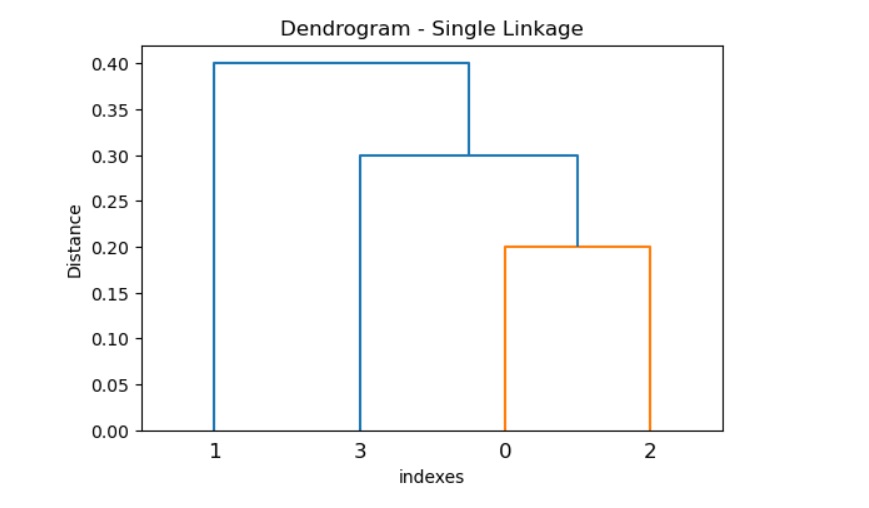
示例 1
以下是 SciPy single() 方法阐述绘制数据点的单个链接的任务。
import numpy as np
from scipy.cluster.hierarchy import single, dendrogram
import matplotlib.pyplot as plt

# Distance matrix
y = np.array([0.5, 0.2, 0.3, 0.4, 0.8, 0.6])

# single linkage clustering
result = single(y)

# Plot the dendrogram
plt.figure(figsize=(6, 4))
dendrogram(result)
plt.title('Dendrogram - Single Linkage')
plt.xlabel('indexes')
plt.ylabel('Distance')
plt.show()
输出
上述代码生成以下结果 −
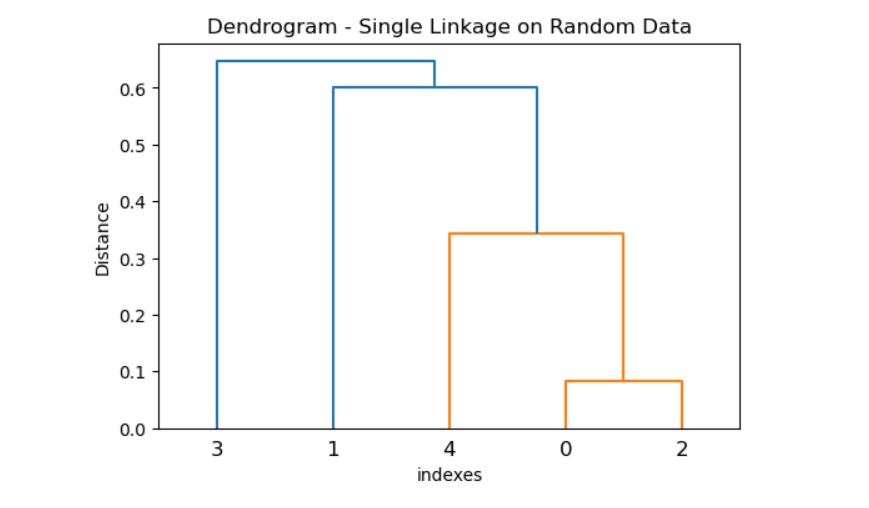
示例 2
下方提供的一个示例阐述在随机数据上执行单个链接聚类的任务。
import numpy as np
from scipy.spatial.distance import pdist
from scipy.cluster.hierarchy import single, dendrogram
import matplotlib.pyplot as plt

# Generate random data
data = np.random.rand(5, 2)

# calculate the distance matrix
y = pdist(data, metric='euclidean')

# single linkage clustering
result = single(y)

# Plot the dendrogram
plt.figure(figsize=(6, 4))
dendrogram(result)
plt.title('Dendrogram - Single Linkage on Random Data')
plt.xlabel('indexes')
plt.ylabel('Distance')
plt.show()
输出
上述代码生成以下结果 −
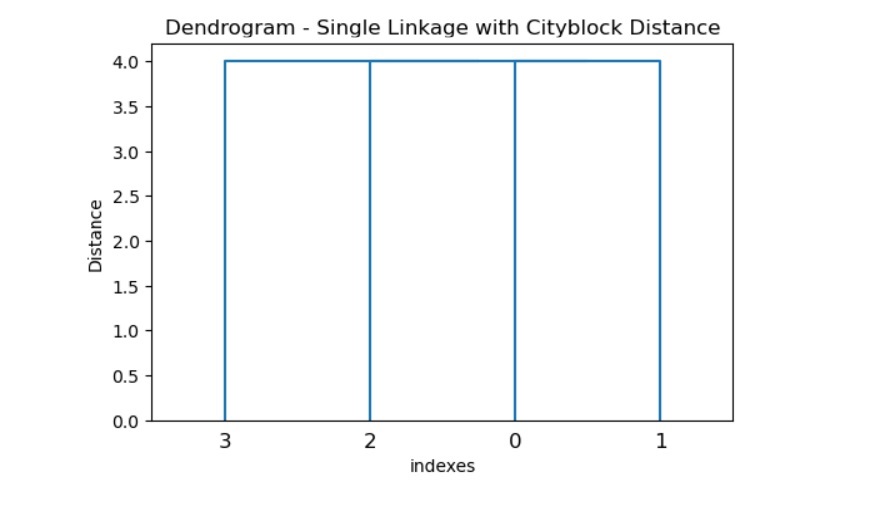
示例 3
在此示例中,我们使用cityblock 作为度量类型来从给定数据集计算距离矩阵,然后利用单个链接聚类。然后我们使用 dendogram() 方法,该方法对聚类进行绘制和可视化很有帮助。
import numpy as np
from scipy.spatial.distance import pdist
from scipy.cluster.hierarchy import single, dendrogram
import matplotlib.pyplot as plt

# Given data
data = np.array([[1, 2], [3, 4], [5, 6], [7, 8]])

# calculate the distance matrix using a custom metric
y = pdist(data, metric='cityblock')

# single linkage clustering
result = single(y)

# Plot the dendrogram
plt.figure(figsize=(6, 4))
dendrogram(result)
plt.title('Dendrogram - Single Linkage with Cityblock Distance')
plt.xlabel('indexes')
plt.ylabel('Distance')
plt.show()
输出
上述代码生成以下结果 −
scipy_reference.htm
广告