- SciPy 教程
- SciPy - 主页
- SciPy - 简介
- SciPy - 环境设置
- SciPy - 基本功能
- SciPy - 群集
- SciPy - 常量
- SciPy - FFTpack
- SciPy - 集成
- SciPy - 插值
- SciPy - 输入和输出
- SciPy - 线性代数
- SciPy - Ndimage
- SciPy - 优化
- SciPy - 统计
- SciPy - CSGraph
- SciPy - 空间
- SciPy - ODR
- SciPy - 专用包
- SciPy 有用资源
- SciPy - 参考
- SciPy - 快速指南
- SciPy - 有用资源
- SciPy - 讨论
SciPy - ascent() 方法
SciPy ascent() 方法用于获取 8 位灰度图像派生图像(512*512),用于演示。此方法允许用户尝试图像处理技术并应用多种滤波器和变换。
语法
以下是 SciPy ascent() 方法的语法 -
ascent()
参数
此方法不接受任何参数。
返回值
此方法返回一个 2D NumPy 数组,显示灰度图像。
示例 1
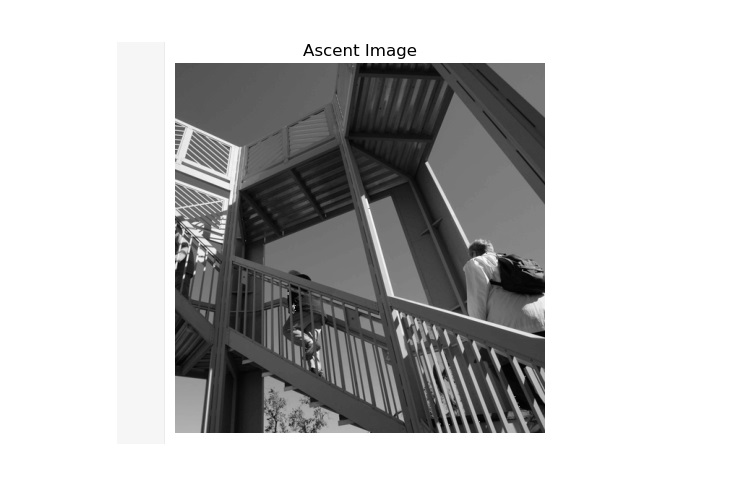
以下是 SciPy ascent() 方法,显示预先存在的 ascent 图像。
import matplotlib.pyplot as plt
from scipy.misc import ascent

# load the ascent image
image = ascent()

# display the image using matplotlib
plt.imshow(image, cmap='gray')
plt.title('Ascent Image')
plt.axis('off')
plt.show()
输出
以上代码生成以下输出 -
示例 2
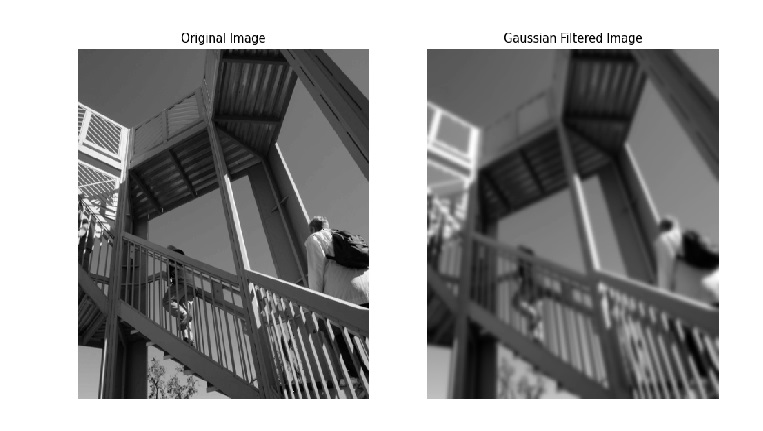
下面的示例区分了原始 ascent 图像和高斯滤波后的图像。
import matplotlib.pyplot as plt
from scipy.ndimage import gaussian_filter
from scipy.misc import ascent

# load the ascent image
image = ascent()

# apply a Gaussian filter to the image
filtered_image = gaussian_filter(image, sigma=3)

# Display the original and filtered images
fig, axes = plt.subplots(1, 2, figsize=(12, 6))
axes[0].imshow(image, cmap='gray')
axes[0].set_title('Original Image')
axes[0].axis('off')

axes[1].imshow(filtered_image, cmap='gray')
axes[1].set_title('Gaussian Filtered Image')
axes[1].axis('off')

plt.show()
输出
以上代码生成以下输出 -
示例 3
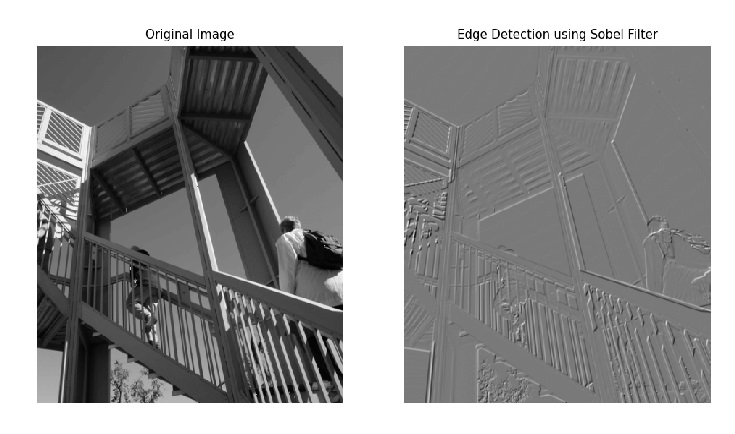
此方法说明了如何使用 Sobel 滤波器对原始 ascent 图像执行边缘检测。该滤波器分别在 x 和 y 轴上进行应用,结果作为边缘检测图像与原始图像一起生成。
import matplotlib.pyplot as plt
from scipy.ndimage import sobel
from scipy.misc import ascent

# load the ascent image
image = ascent()

# apply the Sobel filter to detect edges
sobel_x = sobel(image, axis=0)
sobel_y = sobel(image, axis=1)
edges = sobel_x + sobel_y

# Display the original image and the edge-detected image
fig, axes = plt.subplots(1, 2, figsize=(12, 6))
axes[0].imshow(image, cmap='gray')
axes[0].set_title('Original Image')
axes[0].axis('off')

axes[1].imshow(edges, cmap='gray')
axes[1].set_title('Edge Detection using Sobel Filter')
axes[1].axis('off')

plt.show()
输出
以上代码生成以下输出 -
scipy_reference.htm
广告