- NumPy 教程
- NumPy - 首页
- NumPy - 简介
- NumPy - 环境
- NumPy 数组
- NumPy - Ndarray 对象
- NumPy - 数据类型
- NumPy 创建和操作数组
- NumPy - 数组创建例程
- NumPy - 数组操作
- NumPy - 从现有数据创建数组
- NumPy - 从数值范围创建数组
- NumPy - 迭代数组
- NumPy - 重塑数组
- NumPy - 连接数组
- NumPy - 堆叠数组
- NumPy - 分割数组
- NumPy - 展平数组
- NumPy - 转置数组
- NumPy 索引和切片
- NumPy - 索引和切片
- NumPy - 高级索引
- NumPy 数组属性和操作
- NumPy - 数组属性
- NumPy - 数组形状
- NumPy - 数组大小
- NumPy - 数组步长
- NumPy - 数组元素大小
- NumPy - 广播
- NumPy - 算术运算
- NumPy - 数组加法
- NumPy - 数组减法
- NumPy - 数组乘法
- NumPy - 数组除法
- NumPy 高级数组操作
- NumPy - 交换数组轴
- NumPy - 字节交换
- NumPy - 复制和视图
- NumPy - 元素级数组比较
- NumPy - 过滤数组
- NumPy - 连接数组
- NumPy - 排序、搜索和计数函数
- NumPy - 搜索数组
- NumPy - 数组的并集
- NumPy - 查找唯一行
- NumPy - 创建日期时间数组
- NumPy - 二元运算符
- NumPy - 字符串函数
- NumPy - 数学函数
- NumPy - 统计函数
- NumPy - 矩阵库
- NumPy - 线性代数
- NumPy - Matplotlib
- NumPy - 使用 Matplotlib 绘制直方图
- NumPy - NumPy 的 I/O
- NumPy 排序和高级操作
- NumPy - 排序数组
- NumPy - 沿轴排序
- NumPy - 使用花式索引排序
- NumPy - 结构化数组
- NumPy - 创建结构化数组
- NumPy - 操作结构化数组
- NumPy - 字段访问
- NumPy - 记录数组
- Numpy - 加载数组
- Numpy - 保存数组
- NumPy - 将值追加到数组
- NumPy - 交换数组的列
- NumPy - 向数组插入轴
- NumPy 处理缺失数据
- NumPy - 处理缺失数据
- NumPy - 识别缺失值
- NumPy - 删除缺失数据
- NumPy - 估算缺失数据
- NumPy 性能优化
- NumPy - 使用数组进行性能优化
- NumPy - 使用数组进行矢量化
- NumPy - 数组的内存布局
- Numpy 线性代数
- NumPy - 线性代数
- NumPy - 矩阵库
- NumPy - 矩阵加法
- NumPy - 矩阵减法
- NumPy - 矩阵乘法
- NumPy - 元素级矩阵运算
- NumPy - 点积
- NumPy - 矩阵求逆
- NumPy - 行列式计算
- NumPy - 特征值
- NumPy - 特征向量
- NumPy - 奇异值分解
- NumPy - 求解线性方程组
- NumPy - 矩阵范数
- NumPy 元素级矩阵运算
- NumPy - 求和
- NumPy - 平均值
- NumPy - 中位数
- NumPy - 最小值
- NumPy - 最大值
- NumPy 集合运算
- NumPy - 唯一元素
- NumPy - 交集
- NumPy - 并集
- NumPy - 差集
- NumPy 有用资源
- NumPy 编译器
- NumPy - 快速指南
- NumPy - 有用资源
- NumPy - 讨论
NumPy - 使用 Matplotlib 绘制直方图
NumPy 有一个 **numpy.histogram()** 函数,它以图形方式表示数据的频率分布。矩形具有相同的水平大小,对应于称为 **bin** 的类间隔和对应于频率的 **可变高度**。
numpy.histogram()
numpy.histogram() 函数将输入数组和 bin 作为两个参数。bin 数组中的连续元素充当每个 bin 的边界。
import numpy as np

a = np.array([22,87,5,43,56,73,55,54,11,20,51,5,79,31,27])
np.histogram(a,bins = [0,20,40,60,80,100])
hist,bins = np.histogram(a,bins = [0,20,40,60,80,100])
print hist
print bins
它将产生以下输出 -
[3 4 5 2 1]
[0 20 40 60 80 100]
plt()
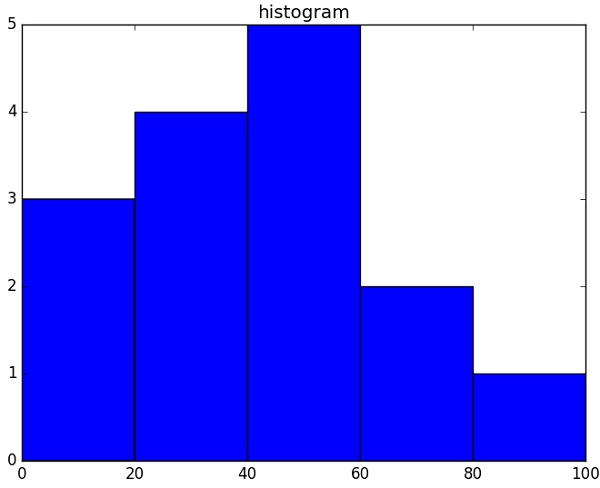
Matplotlib 可以将直方图的这种数值表示转换为图形。pyplot 子模块的 **plt() 函数** 将包含数据的数组和 bin 数组作为参数,并将其转换为直方图。
from matplotlib import pyplot as plt
import numpy as np

a = np.array([22,87,5,43,56,73,55,54,11,20,51,5,79,31,27])
plt.hist(a, bins = [0,20,40,60,80,100])
plt.title("histogram")
plt.show()
它应该产生以下输出 -

广告