- Plotly 教程
- Plotly - 首页
- Plotly - 简介
- Plotly - 环境设置
- Plotly - 在线和离线绘图
- 在 Jupyter Notebook 中内联绘图
- Plotly - 包结构
- Plotly - 导出为静态图像
- Plotly - 图例
- Plotly - 格式化坐标轴和刻度
- Plotly - 子图和内嵌图
- Plotly - 条形图和饼图
- Plotly - 散点图、Scattergl 图和气泡图
- Plotly - 点图和表格
- Plotly - 直方图
- Plotly - 箱线图、小提琴图和等高线图
- Plotly - 分布图、密度图和误差条形图
- Plotly - 热图
- Plotly - 极坐标图和雷达图
- Plotly - OHLC 图、瀑布图和漏斗图
- Plotly - 3D 散点图和曲面图
- Plotly - 添加按钮/下拉菜单
- Plotly - 滑块控件
- Plotly - FigureWidget 类
- Plotly 与 Pandas 和 Cufflinks 的结合使用
- Plotly 与 Matplotlib 和 Chart Studio 的结合使用
- Plotly 有用资源
- Plotly - 快速指南
- Plotly - 有用资源
- Plotly - 讨论
Plotly - 滑块控件
Plotly 有一个方便的滑块,可以通过滑动位于渲染图底部控件上的旋钮来更改图表的数据/样式视图。
滑块控件由不同的属性组成,如下所示:
steps 属性用于定义旋钮在控件上的滑动位置。
method 属性的可能值为restyle | relayout | animate | update | skip,默认值为restyle。
args 属性设置要传递给滑动时在 method 中设置的 Plotly 方法的参数值。
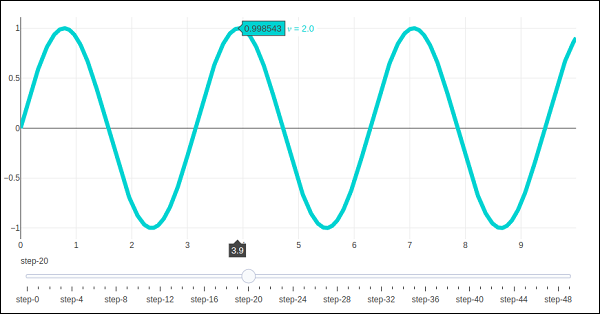
我们现在在一个散点图上部署一个简单的滑块控件,它将随着旋钮沿控件滑动而改变正弦波的频率。滑块配置为具有 50 个步长。首先添加 50 条正弦波曲线轨迹,频率递增,除第 10 条轨迹外,所有轨迹都设置为可见。
然后,我们使用restyle方法配置每个步骤。对于每个步骤,所有其他步骤对象的可见性都设置为false。最后,通过初始化 sliders 属性来更新 Figure 对象的布局。
# Add traces, one for each slider step
for step in np.arange(0, 5, 0.1):
fig.add_trace(
   go.Scatter(
      visible = False,
      line = dict(color = "blue", width = 2),
      name = "𝜈 = " + str(step),
      x = np.arange(0, 10, 0.01),
      y = np.sin(step * np.arange(0, 10, 0.01))
   )
)
fig.data[10].visible=True

# Create and add slider
steps = []
for i in range(len(fig.data)):
step = dict(
   method = "restyle",
   args = ["visible", [False] * len(fig.data)],
)
step["args"][1][i] = True # Toggle i'th trace to "visible"
steps.append(step)
sliders = [dict(active = 10, steps = steps)]
fig.layout.update(sliders=sliders)
iplot(fig)
首先,将显示第 10 条正弦波轨迹。尝试滑动底部水平控件上的旋钮。您将看到频率如下所示发生变化。

广告