- Plotly 教程
- Plotly - 首页
- Plotly - 简介
- Plotly - 环境设置
- Plotly - 在线和离线绘图
- 在 Jupyter Notebook 中内联绘图
- Plotly - 包结构
- Plotly - 导出为静态图像
- Plotly - 图例
- Plotly - 格式化轴和刻度
- Plotly - 子图和嵌入图
- Plotly - 条形图和饼图
- Plotly - 散点图、Scattergl 图和气泡图
- Plotly - 点图和表格
- Plotly - 直方图
- Plotly - 箱线图、小提琴图和等高线图
- Plotly - Distplots、密度图和误差条形图
- Plotly - 热力图
- Plotly - 极坐标图和雷达图
- Plotly - OHLC 图、瀑布图和漏斗图
- Plotly - 3D 散点图和曲面图
- Plotly - 添加按钮/下拉菜单
- Plotly - 滑块控件
- Plotly - FigureWidget 类
- Plotly 与 Pandas 和 Cufflinks
- Plotly 与 Matplotlib 和 Chart Studio
- Plotly 有用资源
- Plotly - 快速指南
- Plotly - 有用资源
- Plotly - 讨论
Plotly 与 Matplotlib 和 Chart Studio
本章介绍名为 Matplotlib 的数据可视化库和名为 Chart Studio 的在线绘图工具。
Matplotlib
Matplotlib 是一个流行的 Python 数据可视化库,能够生成可用于生产但静态的图表。您可以借助 plotly.tools 模块中的 mpl_to_plotly() 函数将静态的 matplotlib 图形 转换为交互式图表。
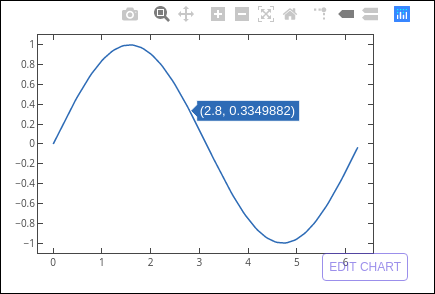
以下脚本使用 Matplotlib 的 PyPlot API 生成了一个 正弦波线图。
from matplotlib import pyplot as plt
import numpy as np
import math
#needed for definition of pi
x = np.arange(0, math.pi*2, 0.05)
y = np.sin(x)
plt.plot(x,y)
plt.xlabel("angle")
plt.ylabel("sine")
plt.title('sine wave')
plt.show()
现在,我们将将其转换为 plotly 图表,如下所示:
fig = plt.gcf()
plotly_fig = tls.mpl_to_plotly(fig)
py.iplot(plotly_fig)
代码的输出如下所示:

Chart Studio
Chart Studio 是 Plotly 提供的一个在线绘图工具。它提供了一个图形用户界面,用于将数据导入和分析到网格中并使用统计工具。图表可以嵌入或下载。它主要用于更快、更高效地创建图表。
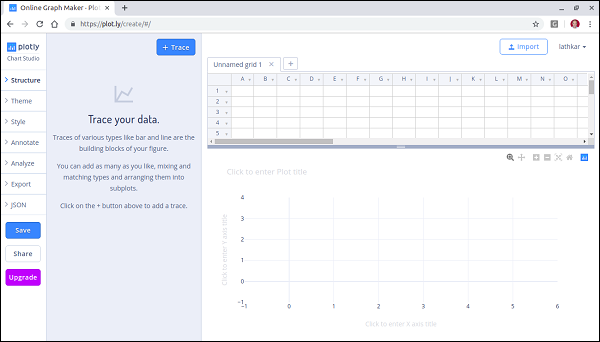
登录 plotly 帐户后,通过访问链接 https://plot.ly/create 启动 Chart Studio 应用。网页在绘图区域下方提供了一个空白工作表。Chart Studio 允许您通过按下 + 轨迹按钮 添加绘图轨迹。

菜单中提供了各种绘图结构元素,例如注释、样式等,以及保存、导出和共享绘图的功能。
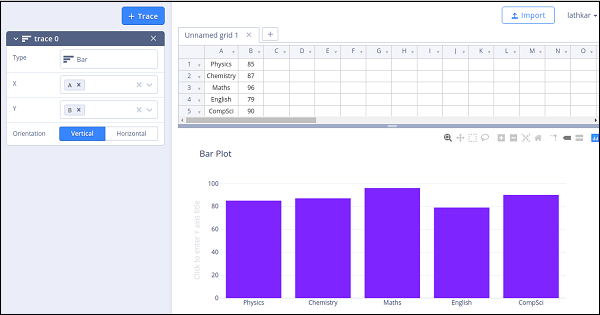
让我们在工作表中添加数据,并从轨迹类型中选择 选择条形图轨迹。

点击类型文本框并选择条形图。

然后,为 x 轴和 y 轴提供数据列,并输入绘图标题。

广告