- Plotly教程
- Plotly - 首页
- Plotly - 简介
- Plotly - 环境搭建
- Plotly - 在线和离线绘图
- 在Jupyter Notebook中内联绘图
- Plotly - 包结构
- Plotly - 导出为静态图像
- Plotly - 图例
- Plotly - 格式化坐标轴和刻度
- Plotly - 子图和内嵌图
- Plotly - 条形图和饼图
- Plotly - 散点图、Scattergl图和气泡图
- Plotly - 点图和表格
- Plotly - 直方图
- Plotly - 箱线图、小提琴图和等高线图
- Plotly - 分布图、密度图和误差条形图
- Plotly - 热力图
- Plotly - 极坐标图和雷达图
- Plotly - OHLC图、瀑布图和漏斗图
- Plotly - 3D散点图和曲面图
- Plotly - 添加按钮/下拉菜单
- Plotly - 滑块控件
- Plotly - FigureWidget 类
- Plotly结合Pandas和Cufflinks
- Plotly结合Matplotlib和Chart Studio
- Plotly有用资源
- Plotly - 快速指南
- Plotly - 有用资源
- Plotly - 讨论
Plotly结合Pandas和Cufflinks
Pandas是Python中非常流行的数据分析库。它也拥有自己的绘图函数支持。但是,Pandas绘图不提供可交互的可视化效果。值得庆幸的是,可以使用**Pandas DataFrame**对象构建Plotly的交互式和动态绘图。
我们首先从简单的列表对象构建DataFrame。
data = [['Ravi',21,67],['Kiran',24,61],['Anita',18,46],['Smita',20,78],['Sunil',17,90]]
df = pd.DataFrame(data,columns = ['name','age','marks'],dtype = float)
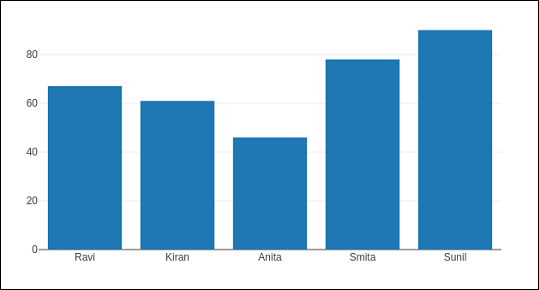
DataFrame的列用作图形对象轨迹的**x**和**y**属性的数据值。在这里,我们将使用**name**和**marks**列生成条形轨迹。
trace = go.Bar(x = df.name, y = df.marks)
fig = go.Figure(data = [trace])
iplot(fig)
一个简单的条形图将如下所示在Jupyter Notebook中显示:

Plotly建立在**d3.js**之上,它是一个专门的图表库,可以使用另一个名为**Cufflinks**的库直接与**Pandas DataFrame**一起使用。
如果尚未安装,请使用您喜欢的包管理器(如**pip**)安装Cufflinks包,如下所示:
pip install cufflinks
or
conda install -c conda-forge cufflinks-py
首先,导入Cufflinks以及其他库,例如**Pandas**和**numpy**,这些库可以将其配置为离线使用。
import cufflinks as cf
cf.go_offline()
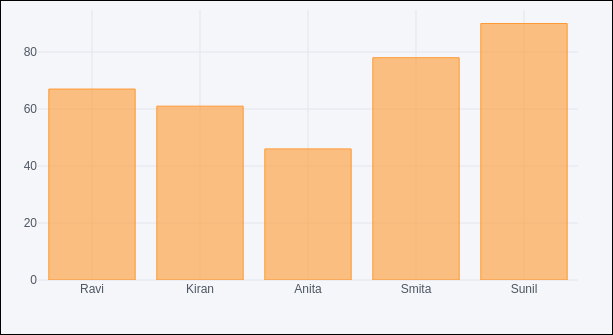
现在,您可以直接使用**Pandas DataFrame**显示各种类型的绘图,而无需像之前那样使用**graph_objs模块**中的轨迹和图形对象。
df.iplot(kind = 'bar', x = 'name', y = 'marks')
条形图,与之前的非常相似,将如下所示:

来自数据库的Pandas DataFrame
除了使用Python列表来构建DataFrame之外,还可以使用不同类型数据库中的数据填充它。例如,可以将来自CSV文件、SQLite数据库表或MySQL数据库表的数据提取到Pandas DataFrame中,最终使用**Figure对象**或**Cufflinks接口**将其用于Plotly图形。
要从**CSV文件**获取数据,我们可以使用Pandas库中的**read_csv()**函数。
import pandas as pd
df = pd.read_csv('sample-data.csv')
如果数据位于**SQLite数据库表**中,则可以使用**SQLAlchemy库**按如下方式检索:
import pandas as pd
from sqlalchemy import create_engine
disk_engine = create_engine('sqlite:///mydb.db')
df = pd.read_sql_query('SELECT name,age,marks', disk_engine)
另一方面,从**MySQL数据库**检索数据到Pandas DataFrame的方式如下:
import pymysql
import pandas as pd
conn = pymysql.connect(host = "localhost", user = "root", passwd = "xxxx", db = "mydb")
cursor = conn.cursor()
cursor.execute('select name,age,marks')
rows = cursor.fetchall()
df = pd.DataFrame( [[ij for ij in i] for i in rows] )
df.rename(columns = {0: 'Name', 1: 'age', 2: 'marks'}, inplace = True)