- Chart.js 教程
- Chart.js - 首页
- Chart.js - 简介
- Chart.js - 安装
- Chart.js - 语法
- Chart.js - 基础
- Chart.js - 颜色
- Chart.js - 选项
- Chart.js - 交互
- Chart.js - 图例
- Chart.js - 标题
- Chart.js - 动画
- Chart.js - 提示框
- Chart.js - 线形图
- Chart.js - 条形图
- Chart.js - 雷达图
- Chart.js - 环形图
- Chart.js - 饼图
- Chart.js - 极地区域图
- Chart.js - 气泡图
- Chart.js - 散点图
- Chart.js - 组合图
- Chart.js - 直角坐标系
- Chart.js - 分类坐标轴
- Chart.js - 径向坐标轴
- Chart.js 有用资源
- Chart.js - 快速指南
- Chart.js - 有用资源
- Chart.js - 讨论
Chart.js - 标题
Chart.js 标题定义了将在图表或图形顶部显示的文本。标题配置的命名空间是 options.plugins.title,而图表标题的全局选项定义在 Chart.defaults.plugins.title 中。
下表列出了我们可以与图表标题一起使用的各种配置选项的描述:
| 名称 | 类型 | 默认值 | 描述 |
|---|---|---|---|
| 对齐方式 (align) | 字符串 | 'center' | 顾名思义,使用此配置可以设置标题的对齐方式。 |
| 颜色 (color) | 颜色 | Chart.defaults.color | 它将定义文本的颜色。 |
| 显示 (display) | 布尔值 | false | 如果为 true,则显示标题;否则不显示。 |
| 全尺寸 (fullSize) | 布尔值 | true | 顾名思义,如果为 true,则框将占据画布的全部宽度/高度。 |
| 位置 (position) | 字符串 | 'top' | 用于设置标题的位置。默认为顶部位置。 |
| 字体 (font) | 字体 | {weight: 'bold'} | 您可以使用各种字体。"Chart.defaults.font" 中提供了选项。 |
| 填充 (padding) | 填充 | 10 | 用于在标题周围应用填充。 |
| 文本 (text) | 字符串|字符串数组 | '' | 顾名思义,它用于显示标题文本。 |
语法
图表标题语法如下:
title: {
   display: true,
   text: 'write heading here',
   color: 'navy',
   position: 'bottom',
}
要显示数据标签,title 的 **enabled** 属性必须为 **true**。如果将其设置为 **false**,则 **title** 将被停用。
示例
让我们来看一个示例,其中我们将使用各种 **标题** 配置:
<!DOCTYPE>
<html>
<head>
   <meta charset- "UTF-8" />
   <meta name="viewport" content="width=device-width, initial-scale=1" />
   <title>chart.js</title>
</head>
<body>
   <canvas id="chartId" aria-label="chart" height="350" width="580"></canvas>
   <script src="https://cdnjs.cloudflare.com/ajax/libs/Chart.js/3.1.1/chart.min.js"></script>
   <script>
      var chrt = document.getElementById("chartId").getContext("2d");
      var chartId = new Chart(chrt, {
         type: 'bar',
         data: {
            labels: ["HTML", "CSS", "JAVASCRIPT", "CHART.JS", "JQUERY", "BOOTSTRP"],
            datasets: [{
               label: "online tutorial subjects",
               data: [20, 40, 30, 35, 30, 20],
               backgroundColor: ['coral', 'aqua', 'pink', 'lightgreen', 'lightblue', 'crimson'],
               borderColor: ['red', 'blue', 'fuchsia', 'green', 'navy', 'black'],
               borderWidth: 2,
            }],
         },
         options: {
            responsive: false,
            plugins: {
               title: {
                  display: true,
                  text: 'Web Application Technologies',
                  color: 'navy',
                  position: 'bottom',
                  align: 'center',
                  font: {
                     weight: 'bold'
                  },
                  padding: 8,
                  fullSize: true,
               }
            }
         },
      });
   </script>
</body>
</html>
输出
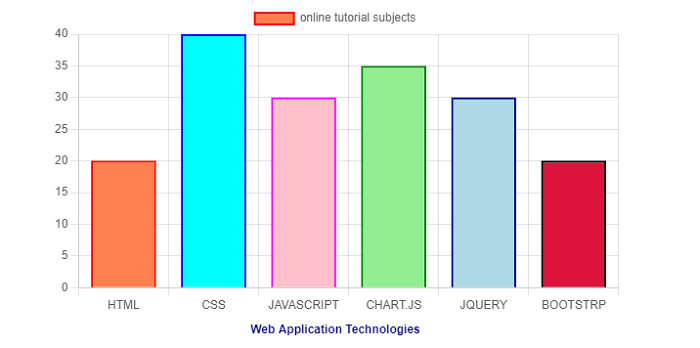
下面的输出图表显示了各种 **标题** 配置:

广告