- Matlab 教程
- MATLAB - 首页
- MATLAB - 概述
- MATLAB - 特性
- MATLAB - 环境设置
- MATLAB - 编辑器
- MATLAB - 在线
- MATLAB - 工作区
- MATLAB - 语法
- MATLAB - 变量
- MATLAB - 命令
- MATLAB - 数据类型
- MATLAB - 运算符
- MATLAB - 日期和时间
- MATLAB - 数字
- MATLAB - 随机数
- MATLAB - 字符串和字符
- MATLAB - 文本格式化
- MATLAB - 时间表
- MATLAB - M 文件
- MATLAB - 冒号表示法
- MATLAB - 数据导入
- MATLAB - 数据导出
- MATLAB - 数据归一化
- MATLAB - 预定义变量
- MATLAB - 决策
- MATLAB - 决策语句
- MATLAB - If End 语句
- MATLAB - If Else 语句
- MATLAB - If…Elseif Else 语句
- MATLAB - 嵌套 If 语句
- MATLAB - Switch 语句
- MATLAB - 嵌套 Switch
- MATLAB - 循环
- MATLAB - 循环
- MATLAB - For 循环
- MATLAB - While 循环
- MATLAB - 嵌套循环
- MATLAB - Break 语句
- MATLAB - Continue 语句
- MATLAB - End 语句
- MATLAB - 数组
- MATLAB - 数组
- MATLAB - 向量
- MATLAB - 转置运算符
- MATLAB - 数组索引
- MATLAB - 多维数组
- MATLAB - 兼容数组
- MATLAB - 分类数组
- MATLAB - 元胞数组
- MATLAB - 矩阵
- MATLAB - 稀疏矩阵
- MATLAB - 表格
- MATLAB - 结构体
- MATLAB - 数组乘法
- MATLAB - 数组除法
- MATLAB - 数组函数
- MATLAB - 函数
- MATLAB - 函数
- MATLAB - 函数参数
- MATLAB - 匿名函数
- MATLAB - 嵌套函数
- MATLAB - 返回语句
- MATLAB - 空函数
- MATLAB - 局部函数
- MATLAB - 全局变量
- MATLAB - 函数句柄
- MATLAB - 滤波函数
- MATLAB - 阶乘
- MATLAB - 私有函数
- MATLAB - 子函数
- MATLAB - 递归函数
- MATLAB - 函数优先级顺序
- MATLAB - Map 函数
- MATLAB - 均值函数
- MATLAB - End 函数
- MATLAB - 错误处理
- MATLAB - 错误处理
- MATLAB - Try...Catch 语句
- MATLAB - 调试
- MATLAB - 绘图
- MATLAB - 绘图
- MATLAB - 绘制数组
- MATLAB - 绘制向量
- MATLAB - 条形图
- MATLAB - 直方图
- MATLAB - 图形
- MATLAB - 2D 线性图
- MATLAB - 3D 绘图
- MATLAB - 格式化绘图
- MATLAB - 对数坐标轴绘图
- MATLAB - 绘制误差条
- MATLAB - 绘制 3D 等值线图
- MATLAB - 极坐标图
- MATLAB - 散点图
- MATLAB - 绘制表达式或函数
- MATLAB - 绘制矩形
- MATLAB - 绘制频谱图
- MATLAB - 绘制网格曲面
- MATLAB - 绘制正弦波
- MATLAB - 插值
- MATLAB - 插值
- MATLAB - 线性插值
- MATLAB - 2D 数组插值
- MATLAB - 3D 数组插值
- MATLAB - 多项式
- MATLAB - 多项式
- MATLAB - 多项式加法
- MATLAB - 多项式乘法
- MATLAB - 多项式除法
- MATLAB - 多项式的导数
- MATLAB - 变换
- MATLAB - 变换
- MATLAB - 拉普拉斯变换
- MATLAB - 拉普拉斯滤波器
- MATLAB - 高斯-拉普拉斯滤波器
- MATLAB - 逆傅里叶变换
- MATLAB - 傅里叶变换
- MATLAB - 快速傅里叶变换
- MATLAB - 2D 逆余弦变换
- MATLAB - 向坐标轴添加图例
- MATLAB - 面向对象
- MATLAB - 面向对象编程
- MATLAB - 类和对象
- MATLAB - 函数重载
- MATLAB - 运算符重载
- MATLAB - 用户自定义类
- MATLAB - 复制对象
- MATLAB - 代数
- MATLAB - 线性代数
- MATLAB - 高斯消元法
- MATLAB - 高斯-约旦消元法
- MATLAB - 行最简形
- MATLAB - 特征值和特征向量
- MATLAB - 积分
- MATLAB - 积分
- MATLAB - 二重积分
- MATLAB - 梯形法则
- MATLAB - 辛普森法则
- MATLAB - 杂项
- MATLAB - 微积分
- MATLAB - 微分
- MATLAB - 矩阵的逆
- MATLAB - GNU Octave
- MATLAB - Simulink
- MATLAB - 有用资源
- MATLAB - 快速指南
- MATLAB - 有用资源
- MATLAB - 讨论
MATLAB - 3D 绘图
MATLAB 提供了强大的工具来创建三维可视化,允许用户在 3D 空间中表示和探索数据。3D 绘图对于可视化复杂数据至关重要,例如曲面、体积和多维数据集。
3D 绘图类型
- 曲面图 - 这些使用表示变量之间关系的曲面来可视化两个变量的函数。
- 网格图 - 网格图显示线框曲面,对于在网格上可视化两个变量的函数很有用。
- 散点图 - 在 3D 中,散点图以三个维度表示单个数据点,通常使用不同的符号或颜色来表示不同的属性。
语法
plot3(X,Y,Z)
plot3(X,Y,Z,LineSpec)
plot3(X1,Y1,Z1,...,Xn,Yn,Zn)
plot3(X1,Y1,Z1,LineSpec1,...,Xn,Yn,Zn,LineSpecn)
plot3(X,Y,Z) - 此方法负责在 3D 空间中绘制 X、Y 和 Z 的坐标。
- 要通过线段绘制连接的坐标,请确保 X、Y 和 Z 是长度相同的向量。
- 要在单个轴集上可视化多个坐标集,请将 X、Y 或 Z 中的至少一个指定为矩阵,而其余的保持为向量。
plot3(X,Y,Z,LineSpec) - 此方法绘制具有指定线型、标记和颜色的 3D 图。
plot3(X1,Y1,Z1,...,Xn,Yn,Zn) - 此方法有助于在同一组轴上绘制多组坐标。
plot3(X1,Y1,Z1,LineSpec1,...,Xn,Yn,Zn,LineSpecn) - plot3 函数允许为各个 XYZ 三元组分配不同的线型、标记和颜色。可以为某些三元组指定 LineSpec,而为其他三元组省略。例如,使用 plot3(X1,Y1,Z1,'o',X2,Y2,Z2) 将标记分配给第一个三元组,但不分配给第二个三元组。
根据上面讨论的语法,让我们尝试一些示例来绘制 3D 图。
示例 1
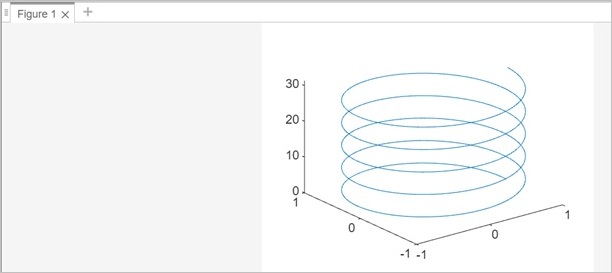
螺旋线可以通过 x、y 和 z 的参数方程生成。螺旋线在柱坐标系中的通用方程为 -
以下是一个将使用 plot3(X,Y,Z) 绘制 3D 螺旋线的示例 -
x=r.cos(t)

y=r.sin(t)

z=h.t
其中 r 是螺旋线的半径,t 是参数,h 表示螺距或螺旋线在一圈完整旋转中垂直移动的距离。
% Parameters
r = 1;  % Radius
h = 1;  % Pitch
t = 0:0.1:10*pi;  % Parameter range

% Parametric equations for x, y, z
x = r * cos(t);
y = r * sin(t);
z = h * t;

% Plotting the helix
plot3(x, y, z);
当您在 matlab 命令窗口中执行相同操作时,输出为 -
示例 2
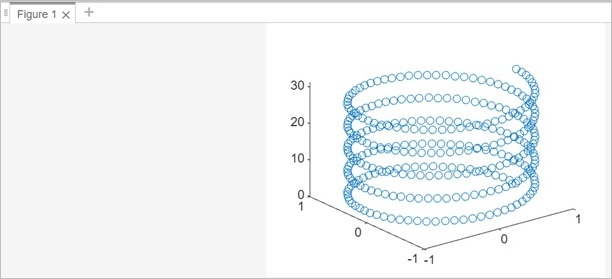
使用上述相同示例,让我们为 3D 绘图使用圆形标记
% Parameters
r = 1;  % Radius
h = 1;  % Pitch
t = 0:0.1:10*pi;  % Parameter range

% Parametric equations for x, y, z
x = r * cos(t);
y = r * sin(t);
z = h * t;

% Plotting the helix
plot3(x, y, z, 'o');
当您在 matlab 命令窗口中执行相同操作时,输出为 -
示例 3
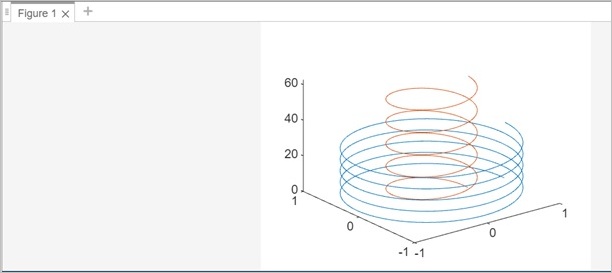
让我们使用此 plot3(X1,Y1,Z1,...,Xn,Yn,Zn) 绘制 3D 的多条线。
% Define parameters and range
t = 0:0.1:10*pi;  % Parameter range

% Line 1
r1 = 1;  % Radius of the first helix
h1 = 1;  % Pitch of the first helix
x1 = r1 * cos(t);
y1 = r1 * sin(t);
z1 = h1 * t;

% Line 2
r2 = 0.5;  % Radius of the second helix
h2 = 2;    % Pitch of the second helix
x2 = r2 * cos(t);
y2 = r2 * sin(t);
z2 = h2 * t;

% Plotting multiple lines
plot3(x1, y1, z1,x2, y2, z2);
当您在 matlab 中执行相同操作时,输出如下 -
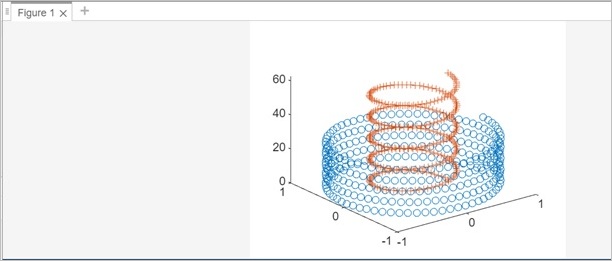
示例 4
plot3(X1,Y1,Z1,LineSpec1,...,Xn,Yn,Zn,LineSpecn) ,让我们为多条线 3D 绘图指定线型。
% Define parameters and range
t = 0:0.1:10*pi;  % Parameter range

% Line 1
r1 = 1;  % Radius of the first helix
h1 = 1;  % Pitch of the first helix
x1 = r1 * cos(t);
y1 = r1 * sin(t);
z1 = h1 * t;

% Line 2
r2 = 0.5;  % Radius of the second helix
h2 = 2;    % Pitch of the second helix
x2 = r2 * cos(t);
y2 = r2 * sin(t);
z2 = h2 * t;

% Plotting multiple lines
plot3(x1, y1, z1,'o',x2, y2, z2,'+');
对于第一条线,我们使用了圆形 (o) 标记,对于第二条线,我们使用了加号 (+) 线型。
代码执行后的输出如下 -
示例 5
在这个示例中,我们将看到标记和线型的自定义。
% Parameters
r = 1;  % Radius
h = 1;  % Pitch
t = 0:0.1:10*pi;  % Parameter range

% Parametric equations for x, y, z
x = r * cos(t);
y = r * sin(t);
z = h * t;

% Plotting the helix
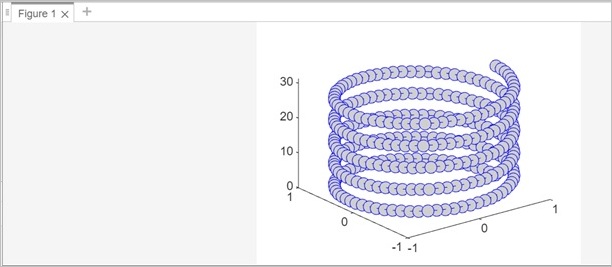
plot3(x, y, z,'-o','Color','b','MarkerSize',10,'MarkerFaceColor','#CFCFCF')
当您在 matlab 命令窗口中执行相同操作时,输出为 -
