- Matlab 教程
- MATLAB - 首页
- MATLAB - 概述
- MATLAB - 功能
- MATLAB - 环境设置
- MATLAB - 编辑器
- MATLAB - 在线版
- MATLAB - 工作区
- MATLAB - 语法
- MATLAB - 变量
- MATLAB - 命令
- MATLAB - 数据类型
- MATLAB - 运算符
- MATLAB - 日期和时间
- MATLAB - 数字
- MATLAB - 随机数
- MATLAB - 字符串和字符
- MATLAB - 文本格式化
- MATLAB - 时间表
- MATLAB - M 文件
- MATLAB - 冒号表示法
- MATLAB - 数据导入
- MATLAB - 数据导出
- MATLAB - 数据归一化
- MATLAB - 预定义变量
- MATLAB - 决策
- MATLAB - 决策语句
- MATLAB - if 语句
- MATLAB - if else 语句
- MATLAB - if…elseif else 语句
- MATLAB - 嵌套 if 语句
- MATLAB - switch 语句
- MATLAB - 嵌套 switch
- MATLAB - 循环
- MATLAB - 循环
- MATLAB - for 循环
- MATLAB - while 循环
- MATLAB - 嵌套循环
- MATLAB - break 语句
- MATLAB - continue 语句
- MATLAB - end 语句
- MATLAB - 数组
- MATLAB - 数组
- MATLAB - 向量
- MATLAB - 转置运算符
- MATLAB - 数组索引
- MATLAB - 多维数组
- MATLAB - 兼容数组
- MATLAB - 分类数组
- MATLAB - 元胞数组
- MATLAB - 矩阵
- MATLAB - 稀疏矩阵
- MATLAB - 表格
- MATLAB - 结构体
- MATLAB - 数组乘法
- MATLAB - 数组除法
- MATLAB - 数组函数
- MATLAB - 函数
- MATLAB - 函数
- MATLAB - 函数参数
- MATLAB - 匿名函数
- MATLAB - 嵌套函数
- MATLAB - return 语句
- MATLAB - 无返回值函数
- MATLAB - 局部函数
- MATLAB - 全局变量
- MATLAB - 函数句柄
- MATLAB - filter 函数
- MATLAB - 阶乘
- MATLAB - 私有函数
- MATLAB - 子函数
- MATLAB - 递归函数
- MATLAB - 函数优先级
- MATLAB - map 函数
- MATLAB - mean 函数
- MATLAB - end 函数
- MATLAB - 错误处理
- MATLAB - 错误处理
- MATLAB - try…catch 语句
- MATLAB - 调试
- MATLAB - 绘图
- MATLAB - 绘图
- MATLAB - 绘制数组
- MATLAB - 绘制向量
- MATLAB - 条形图
- MATLAB - 直方图
- MATLAB - 图形
- MATLAB - 二维线图
- MATLAB - 三维图
- MATLAB - 格式化绘图
- MATLAB - 对数坐标轴绘图
- MATLAB - 绘制误差条
- MATLAB - 绘制三维等高线图
- MATLAB - 极坐标图
- MATLAB - 散点图
- MATLAB - 绘制表达式或函数
- MATLAB - 绘制矩形
- MATLAB - 绘制频谱图
- MATLAB - 绘制网格曲面图
- MATLAB - 绘制正弦波
- MATLAB - 插值
- MATLAB - 插值
- MATLAB - 线性插值
- MATLAB - 二维数组插值
- MATLAB - 三维数组插值
- MATLAB - 多项式
- MATLAB - 多项式
- MATLAB - 多项式加法
- MATLAB - 多项式乘法
- MATLAB - 多项式除法
- MATLAB - 多项式的导数
- MATLAB - 变换
- MATLAB - 变换函数
- MATLAB - 拉普拉斯变换
- MATLAB - 拉普拉斯滤波器
- MATLAB - 高斯-拉普拉斯滤波器
- MATLAB - 逆傅里叶变换
- MATLAB - 傅里叶变换
- MATLAB - 快速傅里叶变换
- MATLAB - 二维逆余弦变换
- MATLAB - 向坐标轴添加图例
- MATLAB - 面向对象
- MATLAB - 面向对象编程
- MATLAB - 类和对象
- MATLAB - 函数重载
- MATLAB - 运算符重载
- MATLAB - 用户自定义类
- MATLAB - 复制对象
- MATLAB - 代数
- MATLAB - 线性代数
- MATLAB - 高斯消元法
- MATLAB - 高斯-约旦消元法
- MATLAB - 简化行阶梯形式
- MATLAB - 特征值和特征向量
- MATLAB - 积分
- MATLAB - 积分
- MATLAB - 二重积分
- MATLAB - 梯形法则
- MATLAB - 辛普森法则
- MATLAB - 其他
- MATLAB - 微积分
- MATLAB - 微分
- MATLAB - 矩阵求逆
- MATLAB - GNU Octave
- MATLAB - Simulink
- MATLAB - 有用资源
- MATLAB - 快速指南
- MATLAB - 有用资源
- MATLAB - 讨论
MATLAB - 绘制向量
在 MATLAB 中,向量是用于存储和处理元素序列的基本数据结构。它们表示可以包含数字、字符、逻辑值或其他 MATLAB 对象的一维数组。
MATLAB 中的向量可以通过几种方式创建:
- 行向量 - 使用方括号创建,元素之间用空格或逗号分隔。例如:v = [1, 2, 3, 4]。
- 列向量 - 与行向量类似,但元素之间用分号分隔以创建列。例如:v = [1; 2; 3; 4]。
- 使用函数 - MATLAB 函数(如 linspace、ones、zeros 和 rand)可以生成具有特定特征的向量(例如,值范围、全是 1、全是 0、随机值)。
MATLAB 中的向量允许进行各种运算,例如加法、减法、逐元素乘法、除法等等。它们在 MATLAB 中的数学计算、信号处理、数据分析和绘图中起着至关重要的作用。
创建 Matlab 向量
创建 Matlab 向量非常容易,以下是行向量和列向量的示例:
% Row vector with elements 1, 2, 3, 4
row_vector = [1, 2, 3, 4];

% Column vector with elements 5, 6, 7, 8
column_vector = [5; 6; 7; 8];
让我们使用函数来创建向量,如下所示:
% Creates a row vector of 10 linearly spaced points from 0 to 1
linear_vector = linspace(0, 1, 10);

% Row vector of 5 ones
ones_vector = ones(1, 5);

% Column vector of 4 zeros
zeros_vector = zeros(4, 1);
使用的函数是 linspace()、ones() 和 zeros()。
在 Matlab 中绘制向量
可以使用 quiver() 函数在 Matlab 中绘制向量。
语法
quiver(X,Y,U,V)
quiver(U,V)
quiver(___,scale)
quiver(___,LineSpec)
让我们详细了解每种语法。
quiver(X,Y,U,V) - MATLAB 中的 quiver(X,Y,U,V) 函数使用在特定笛卡尔坐标 X 和 Y 处的方向分量 U 和 V 生成箭头图。例如,每个箭头都从坐标 X(1)、Y(1) 开始,水平方向基于 U(1),垂直方向基于 V(1)。默认情况下,quiver 会自动调整箭头长度以防止重叠。
quiver(U,V) - MATLAB 中的 quiver(U,V) 函数使用在均匀分布的位置处的方向分量 U 和 V 生成箭头图。当 U 和 V 是向量时,箭头的 x 坐标跨越从 1 到 U 和 V 中元素的数量,而它们的 y 坐标都设置为 1。如果 U 和 V 是矩阵,则箭头的 x 坐标跨越从 1 到 U 和 V 中的列数,而它们的 y 坐标范围从 1 到 U 和 V 中的行数。
quiver(___,scale) - MATLAB 中的 quiver(___, scale) 函数按以下方式修改箭头长度:
- 如果 scale 是正值,则该函数会自动调整箭头大小以防止重叠,然后按指定的比例因子缩放它们。例如,比例因子为 2 会使箭头长度加倍,而 0.5 会使箭头长度减半。
- 当 scale 设置为 'off' 或 0(例如,quiver(X,Y,U,V,'off'))时,自动缩放功能将被禁用,从而禁用箭头长度的自动调整。
quiver(___,LineSpec) - quiver(___, LineSpec) 函数配置绘图的线型、标记和颜色。标记位于 X 和 Y 指定的坐标处。当使用 LineSpec 指定标记时,不会显示箭头。要显示带有标记的箭头,最好单独设置 Marker 属性。
向量绘图示例
以下是一些向量绘图示例:
示例 1
在此示例中,X 和 Y 表示箭头开始的坐标。
U 和 V 表示方向分量,U 确定箭头的水平长度,V 确定箭头的垂直长度。
% Define coordinates and directional components
X = [1, 2, 3]; % X-coordinates
Y = [1, 1, 1]; % Y-coordinates
U = [2, -1, 3]; % Horizontal components
V = [3, 1, -2]; % Vertical components

% Plotting arrows using quiver

quiver(X, Y, U, V);

% Setting plot properties
xlabel('X-axis');
ylabel('Y-axis');
title('Arrow Plot using quiver');
让我们执行代码并检查输出:
示例 2
在此示例中,U_vector 和 V_vector 分别表示沿 x 轴和 y 轴的方向分量。
由于 U_vector 和 V_vector 都是向量,因此箭头的 x 坐标将跨越从 1 到向量中元素的数量,而所有箭头的 y 坐标都将设置为 1。
% Creating vectors U and V
U_vector = [1, 2, 3, 4]; % Directional components for x-axis
V_vector = [2, 1, 3, 2]; % Directional components for y-axis

% Plotting arrows using quiver with vectors
quiver(U_vector, V_vector);

% Setting plot properties
xlabel('X-axis');
ylabel('Y-axis');
title('Arrow Plot using quiver with Vectors');
执行后,输出如下:
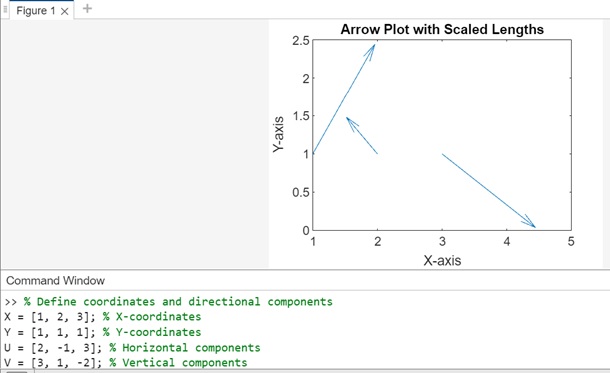
示例 3
使用正值缩放图形。在此示例中,X、Y、U 和 V 定义坐标和方向分量。quiver 函数与比例因子 1.5 一起使用,该因子会自动调整和缩放箭头长度。
% Define coordinates and directional components
X = [1, 2, 3]; % X-coordinates
Y = [1, 1, 1]; % Y-coordinates
U = [2, -1, 3]; % Horizontal components
V = [3, 1, -2]; % Vertical components

% Plotting arrows with automatic scaling by a factor of 1.5

quiver(X, Y, U, V, 1.5);

% Setting plot properties
xlabel('X-axis');
ylabel('Y-axis');
title('Arrow Plot with Scaled Lengths');
执行后,输出为:
示例 4
此示例将演示 LineSpec 的用法。因此,X、Y、U 和 V 定义坐标和方向分量。quiver() 函数与 LineSpec 参数 'ro' 一起使用,该参数将红色圆圈设置为指定坐标处的标记,而不会显示箭头。
% Define coordinates and directional components
X = [1, 2, 3]; % X-coordinates
Y = [1, 1, 1]; % Y-coordinates
U = [2, -1, 3]; % Horizontal components
V = [3, 1, -2]; % Vertical components

% Plotting arrows with LineSpec to show markers without arrowheads
quiver(X, Y, U, V, 'ro'); % 'ro' sets red color and circles as markers

% Setting plot properties
xlabel('X-axis');
ylabel('Y-axis');
title('Arrow Plot with Markers using LineSpec');
执行后的输出为: