- Matlab 教程
- MATLAB - 首页
- MATLAB - 概述
- MATLAB - 特性
- MATLAB - 环境设置
- MATLAB - 编辑器
- MATLAB - 在线
- MATLAB - 工作区
- MATLAB - 语法
- MATLAB - 变量
- MATLAB - 命令
- MATLAB - 数据类型
- MATLAB - 运算符
- MATLAB - 日期和时间
- MATLAB - 数字
- MATLAB - 随机数
- MATLAB - 字符串和字符
- MATLAB - 文本格式化
- MATLAB - 时间表
- MATLAB - M 文件
- MATLAB - 冒号表示法
- MATLAB - 数据导入
- MATLAB - 数据输出
- MATLAB - 数据归一化
- MATLAB - 预定义变量
- MATLAB - 决策
- MATLAB - 决策语句
- MATLAB - If End 语句
- MATLAB - If Else 语句
- MATLAB - If…Elseif Else 语句
- MATLAB - 嵌套 If 语句
- MATLAB - Switch 语句
- MATLAB - 嵌套 Switch
- MATLAB - 循环
- MATLAB - 循环
- MATLAB - For 循环
- MATLAB - While 循环
- MATLAB - 嵌套循环
- MATLAB - Break 语句
- MATLAB - Continue 语句
- MATLAB - End 语句
- MATLAB - 数组
- MATLAB - 数组
- MATLAB - 向量
- MATLAB - 转置运算符
- MATLAB - 数组索引
- MATLAB - 多维数组
- MATLAB - 兼容数组
- MATLAB - 分类数组
- MATLAB - 元胞数组
- MATLAB - 矩阵
- MATLAB - 稀疏矩阵
- MATLAB - 表格
- MATLAB - 结构体
- MATLAB - 数组乘法
- MATLAB - 数组除法
- MATLAB - 数组函数
- MATLAB - 函数
- MATLAB - 函数
- MATLAB - 函数参数
- MATLAB - 匿名函数
- MATLAB - 嵌套函数
- MATLAB - 返回语句
- MATLAB - 空函数
- MATLAB - 局部函数
- MATLAB - 全局变量
- MATLAB - 函数句柄
- MATLAB - 滤波器函数
- MATLAB - 阶乘
- MATLAB - 私有函数
- MATLAB - 子函数
- MATLAB - 递归函数
- MATLAB - 函数优先级顺序
- MATLAB - 映射函数
- MATLAB - 平均值函数
- MATLAB - 结束函数
- MATLAB - 错误处理
- MATLAB - 错误处理
- MATLAB - Try...Catch 语句
- MATLAB - 调试
- MATLAB - 绘图
- MATLAB - 绘图
- MATLAB - 绘制数组
- MATLAB - 绘制向量
- MATLAB - 条形图
- MATLAB - 直方图
- MATLAB - 图形
- MATLAB - 2D 线图
- MATLAB - 3D 图
- MATLAB - 格式化绘图
- MATLAB - 对数坐标轴图
- MATLAB - 绘制误差条
- MATLAB - 绘制 3D 等值线图
- MATLAB - 极坐标图
- MATLAB - 散点图
- MATLAB - 绘制表达式或函数
- MATLAB - 绘制矩形
- MATLAB - 绘制频谱图
- MATLAB - 绘制网格曲面
- MATLAB - 绘制正弦波
- MATLAB - 插值
- MATLAB - 插值
- MATLAB - 线性插值
- MATLAB - 2D 数组插值
- MATLAB - 3D 数组插值
- MATLAB - 多项式
- MATLAB - 多项式
- MATLAB - 多项式加法
- MATLAB - 多项式乘法
- MATLAB - 多项式除法
- MATLAB - 多项式的导数
- MATLAB - 变换
- MATLAB - 变换
- MATLAB - 拉普拉斯变换
- MATLAB - 拉普拉斯滤波器
- MATLAB - 高斯-拉普拉斯滤波器
- MATLAB - 逆傅里叶变换
- MATLAB - 傅里叶变换
- MATLAB - 快速傅里叶变换
- MATLAB - 2D 逆余弦变换
- MATLAB - 向坐标轴添加图例
- MATLAB - 面向对象
- MATLAB - 面向对象编程
- MATLAB - 类和对象
- MATLAB - 函数重载
- MATLAB - 运算符重载
- MATLAB - 用户定义类
- MATLAB - 复制对象
- MATLAB - 代数
- MATLAB - 线性代数
- MATLAB - 高斯消元法
- MATLAB - 高斯-约旦消元法
- MATLAB - 简化行阶梯形式
- MATLAB - 特征值和特征向量
- MATLAB - 积分
- MATLAB - 积分
- MATLAB - 二重积分
- MATLAB - 梯形法则
- MATLAB - 辛普森法则
- MATLAB - 杂项
- MATLAB - 微积分
- MATLAB - 微分
- MATLAB - 矩阵的逆
- MATLAB - GNU Octave
- MATLAB - Simulink
- MATLAB - 有用资源
- MATLAB - 快速指南
- MATLAB - 有用资源
- MATLAB - 讨论
MATLAB - 绘制数组
数据可视化有助于理解复杂的信息,而 MATLAB 作为一种强大的编程语言,可以将原始数字转换为有意义的视觉表示。
MATLAB 提供了强大的数据可视化工具,绘制数组是将数值信息以图形方式表示的基本技术。无论您是处理一维数组、矩阵还是多维数组,MATLAB 的绘图函数都提供了各种选项来创建有洞察力的可视化效果。
MATLAB 提供了广泛的绘图函数和自定义选项,使用户能够创建各种各样的可视化效果。
在 Matlab 中进行绘图时,我们具有以下优势:
- 线图、散点图、条形图、直方图、曲面图等满足 Matlab 中不同数据类型和分析需求。
- 您可以控制颜色、标记、线型、坐标轴属性和注释,从而可以根据特定需求调整绘图。
- MATLAB 的绘图可以进行交互,允许缩放、平移和数据检查,以便进行更深入的探索。
matlab 中可用的基本绘图函数如下:
- plot() 函数 - 创建线图以可视化变量或函数之间的关系。
- scatter() 函数 - 生成散点图,非常适合显示单个数据点。
- bar() 函数 - 构造条形图,用于比较分类数据。
在 Matlab 中绘制数组
要在 matlab 中绘制数组,我们需要首先创建一个数组。一个用于 X 轴,另一个用于 Y 轴。
让我们以如下所示的简单示例为例:
示例 1
X = [16, 2, 3,13, 5];
Y = [1, 3, 5, 7, 20];
因此,这里 X 现在是将在 X 轴上绘制的坐标,而 Y 数组具有将在 Y 轴上绘制的坐标。
现在 X 和 Y 数组已定义,让我们利用 Matlab 中可用的 plot() 函数来绘制它。
用于绘图的代码如下:
% An array with coordinates that needs to be plotted
X = [16, 2, 3,13, 5];
Y = [1, 3, 5, 7, 20];
% Plotting the array using plot() function
plot(X, Y);
现在让我们在 matlab 中执行代码,这将向我们显示线图,其中 X 中的值绘制在 x 轴上,数组 Y 中的值绘制在 y 轴上。
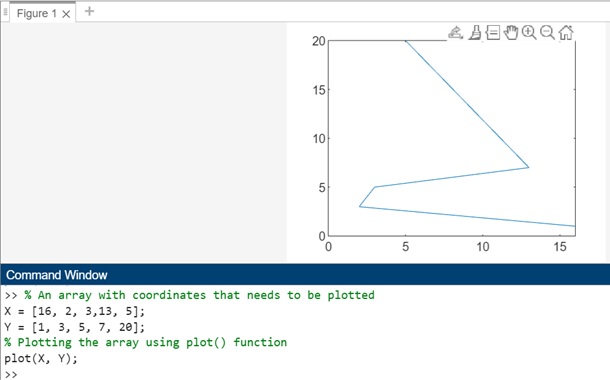
执行后,您可以看到显示绘制值线图的图形。让我们为它添加更多自定义。
首先,让我们为 X 轴和 Y 轴添加标签,现在我们在图形上看不到任何标签。
实现此目的的代码如下所示:
% An array with coordinates that needs to be plotted
X = [16, 2, 3,13, 5];
Y = [1, 3, 5, 7, 20];
% Plotting the array using plot() function
plot(X, Y);
执行后的输出如下:
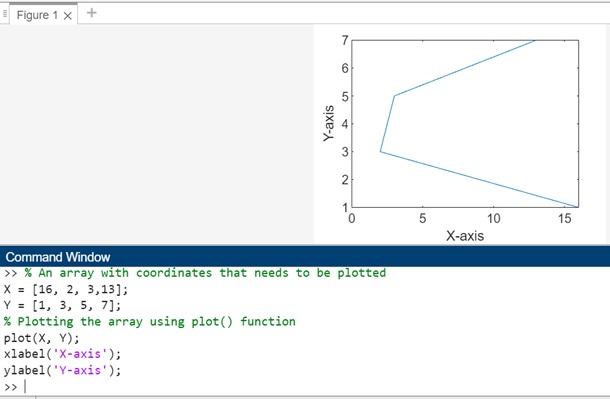
要添加标签,只需使用 xlabel 和 ylabel 方法,并使用您希望在轴上看到的标签。
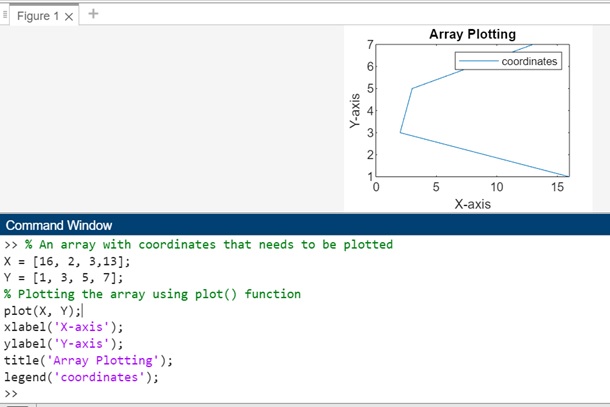
现在让我们使用 legend() 和 title() 方法向上面的图形添加图例和标题。相同的代码如下所示:
% An array with coordinates that needs to be plotted
X = [16, 2, 3,13];
Y = [1, 3, 5, 7];
% Plotting the array using plot() function
plot(X, Y);
xlabel('X-axis');
ylabel('Y-axis');
title('Array Plotting');
legend('coordinates');
当您执行相同操作时,输出如下所示:
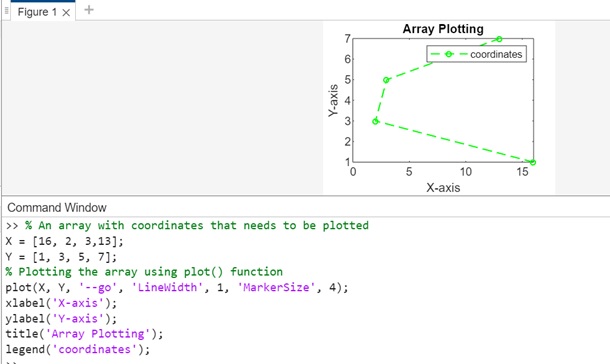
现在让我们将线绘制转换为虚线,标记为圆圈,颜色为绿色。它的代码 -
% An array with coordinates that needs to be plotted
X = [16, 2, 3,13];
Y = [1, 3, 5, 7];
% Plotting the array using plot() function
plot(X, Y, '--go', 'LineWidth', 1, 'MarkerSize', 4);
xlabel('X-axis');
ylabel('Y-axis');
title('Array Plotting');
legend('coordinates');
执行后的输出为:
示例 2
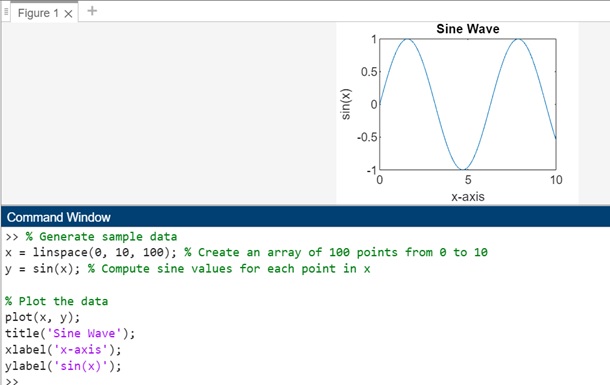
使用数组进行绘图的另一个示例如下所示:
% Generate sample data
x = linspace(0, 10, 100); % Create an array of 100 points from 0 to 10
y = sin(x); % Compute sine values for each point in x

% Plot the data
plot(x, y);
title('Sine Wave');
xlabel('x-axis');
ylabel('sin(x)');
这里 linspace() 生成一个从 0 到 10 的 100 个点的数组。sin() 计算数组中每个点的正弦值。plot() 使用 x 和 y 值创建线图。
title()、xlabel() 和 ylabel() 方法向绘图添加标签和标题。
此示例通过绘制从 0 到 10 的数组 x 相对的 sin 函数来生成正弦波。生成的绘图展示了 x 值与其相应的正弦值之间的关系。
执行后的输出如下:
使用数组进行多线绘制
考虑以下我们获得的数据:
x = linspace(0, 10, 100); % Create an array of 100 points from 0 to 10
y1 = sin(x); % Compute sine values for each point in x
y2 = cos(x); % Compute cosine values for each point in x
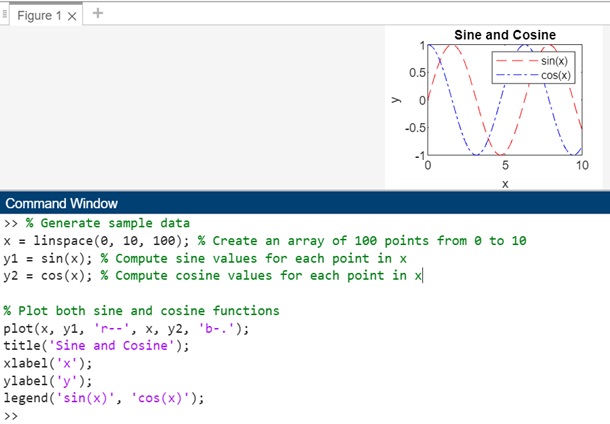
linspace(0,10,100) 创建一个从 0 到 10 的 100 个点的数组。此外,我们有 sin(x) 和 cos(x),它们将为 x 中的每个数组值生成正弦值,并为 x 中的每个数组值生成余弦值。
让我们使用 plot() 函数进行绘图。代码如下:
% Generate sample data
x = linspace(0, 10, 100); % Create an array of 100 points from 0 to 10
y1 = sin(x); % Compute sine values for each point in x
y2 = cos(x); % Compute cosine values for each point in x

% Plot both sine and cosine functions
plot(x, y1, 'r--', x, y2, 'b-.');
title('Sine and Cosine');
xlabel('x');
ylabel('y');
legend('sin(x)', 'cos(x)');
当您在 matlab 中执行代码时,输出为:
