- Matlab 教程
- MATLAB - 首页
- MATLAB - 概述
- MATLAB - 特性
- MATLAB - 环境设置
- MATLAB - 编辑器
- MATLAB - 在线版
- MATLAB - 工作区
- MATLAB - 语法
- MATLAB - 变量
- MATLAB - 命令
- MATLAB - 数据类型
- MATLAB - 运算符
- MATLAB - 日期和时间
- MATLAB - 数字
- MATLAB - 随机数
- MATLAB - 字符串和字符
- MATLAB - 文本格式化
- MATLAB - 时间表
- MATLAB - M 文件
- MATLAB - 冒号表示法
- MATLAB - 数据导入
- MATLAB - 数据导出
- MATLAB - 数据归一化
- MATLAB - 预定义变量
- MATLAB - 决策
- MATLAB - 决策语句
- MATLAB - If End 语句
- MATLAB - If Else 语句
- MATLAB - If…Elseif Else 语句
- MATLAB - 嵌套 If 语句
- MATLAB - Switch 语句
- MATLAB - 嵌套 Switch
- MATLAB - 循环
- MATLAB - 循环
- MATLAB - For 循环
- MATLAB - While 循环
- MATLAB - 嵌套循环
- MATLAB - Break 语句
- MATLAB - Continue 语句
- MATLAB - End 语句
- MATLAB - 数组
- MATLAB - 数组
- MATLAB - 向量
- MATLAB - 转置运算符
- MATLAB - 数组索引
- MATLAB - 多维数组
- MATLAB - 兼容数组
- MATLAB - 分类数组
- MATLAB - 元胞数组
- MATLAB - 矩阵
- MATLAB - 稀疏矩阵
- MATLAB - 表格
- MATLAB - 结构体
- MATLAB - 数组乘法
- MATLAB - 数组除法
- MATLAB - 数组函数
- MATLAB - 函数
- MATLAB - 函数
- MATLAB - 函数参数
- MATLAB - 匿名函数
- MATLAB - 嵌套函数
- MATLAB - 返回语句
- MATLAB - 空函数
- MATLAB - 局部函数
- MATLAB - 全局变量
- MATLAB - 函数句柄
- MATLAB - 滤波器函数
- MATLAB - 阶乘
- MATLAB - 私有函数
- MATLAB - 子函数
- MATLAB - 递归函数
- MATLAB - 函数优先级顺序
- MATLAB - Map 函数
- MATLAB - Mean 函数
- MATLAB - End 函数
- MATLAB - 错误处理
- MATLAB - 错误处理
- MATLAB - Try...Catch 语句
- MATLAB - 调试
- MATLAB - 绘图
- MATLAB - 绘图
- MATLAB - 绘制数组
- MATLAB - 绘制向量
- MATLAB - 条形图
- MATLAB - 直方图
- MATLAB - 图形
- MATLAB - 2D 线性图
- MATLAB - 3D 图形
- MATLAB - 图形格式化
- MATLAB - 对数坐标轴图形
- MATLAB - 绘制误差条
- MATLAB - 绘制 3D 等值线图
- MATLAB - 极坐标图
- MATLAB - 散点图
- MATLAB - 绘制表达式或函数
- MATLAB - 绘制矩形
- MATLAB - 绘制频谱图
- MATLAB - 绘制网格曲面
- MATLAB - 绘制正弦波
- MATLAB - 插值
- MATLAB - 插值
- MATLAB - 线性插值
- MATLAB - 2D 数组插值
- MATLAB - 3D 数组插值
- MATLAB - 多项式
- MATLAB - 多项式
- MATLAB - 多项式加法
- MATLAB - 多项式乘法
- MATLAB - 多项式除法
- MATLAB - 多项式的导数
- MATLAB - 变换
- MATLAB - 变换函数
- MATLAB - 拉普拉斯变换
- MATLAB - 拉普拉斯滤波器
- MATLAB - 高斯-拉普拉斯滤波器
- MATLAB - 逆傅里叶变换
- MATLAB - 傅里叶变换
- MATLAB - 快速傅里叶变换
- MATLAB - 2D 逆余弦变换
- MATLAB - 为坐标轴添加图例
- MATLAB - 面向对象
- MATLAB - 面向对象编程
- MATLAB - 类和对象
- MATLAB - 函数重载
- MATLAB - 运算符重载
- MATLAB - 用户定义类
- MATLAB - 复制对象
- MATLAB - 代数
- MATLAB - 线性代数
- MATLAB - 高斯消去法
- MATLAB - 高斯-约旦消去法
- MATLAB - 简化行阶梯形式
- MATLAB - 特征值和特征向量
- MATLAB - 积分
- MATLAB - 积分
- MATLAB - 二重积分
- MATLAB - 梯形法则
- MATLAB - 辛普森法则
- MATLAB - 杂项
- MATLAB - 微积分
- MATLAB - 微分
- MATLAB - 矩阵的逆
- MATLAB - GNU Octave
- MATLAB - Simulink
- MATLAB - 有用资源
- MATLAB - 快速指南
- MATLAB - 有用资源
- MATLAB - 讨论
MATLAB - 高斯-拉普拉斯滤波器
高斯滤波器是一种用于图像处理的线性滤波器,用于模糊或平滑图像。它以高斯函数命名,该函数用于定义滤波器的形状。高斯滤波器通常用于减少图像中的噪声和细节,使其更适合进一步处理或分析。
高斯-拉普拉斯 (LoG) 滤波器是一种流行的图像增强和边缘检测滤波器,用于图像处理。它是两种滤波器的组合:高斯滤波器和拉普拉斯滤波器。高斯滤波器用于平滑图像并减少噪声,而拉普拉斯滤波器用于检测边缘。
高斯-拉普拉斯滤波器可用于检测图像中不同尺度的边缘。通过改变高斯滤波器的标准差,可以控制检测边缘的尺度。较小的标准差检测更精细的细节,而较大的标准差检测更宽泛的特征。
让我们看看几个高斯-拉普拉斯滤波器的示例。
示例 1:使用 fspecial() 函数
fspecial() 函数用于创建高斯滤波器,然后计算该高斯的拉普拉斯算子以创建 LoG 滤波器。但是,拉普拉斯滤波器期望高斯滤波器为 double 类型。
我们的代码如下:
% Read the image
img = imread('peppers.jpg');

% Convert the image to grayscale
if size(img, 3) == 3
    img_gray = rgb2gray(img);
else
    img_gray = img;
end

% Create a Gaussian filter
sigma = 2; % Standard deviation of the Gaussian filter
hsize = 2 * ceil(3 * sigma) + 1; % Filter size
gaussian_filter = fspecial('gaussian', hsize, sigma);

% Create a Laplacian of Gaussian filter
log_filter = fspecial('log', hsize, sigma);

% Apply the LoG filter to the image
filtered_img = imfilter(double(img_gray), log_filter, 'conv', 'replicate');

% Display the original and filtered images
subplot(1, 2, 1);
imshow(img_gray);
title('Original Image');

subplot(1, 2, 2);
imshow(uint8(filtered_img));
title('Laplacian of Gaussian Filtered Image');
让我们详细了解代码:
img = imread('peppers.jpg');
此处,它从当前目录读取图像“peppers.jpg”并将其存储在变量 img 中。
if size(img, 3) == 3
    img_gray = rgb2gray(img);
else
    img_gray = img;
end
如果图像为彩色(RGB 格式),则使用 rgb2gray 函数将其转换为灰度。灰度图像存储在变量 img_gray 中。如果图像已经是灰度图像,则按原样存储。
sigma = 2; % Standard deviation of the Gaussian filter
hsize = 2 * ceil(3 * sigma) + 1; % Filter size
gaussian_filter = fspecial('gaussian', hsize, sigma);
上面的代码创建了高斯滤波器。这里,我们定义了高斯滤波器的标准差 sigma 并根据标准差计算滤波器大小 hsize。然后,我们使用 fspecial 函数创建高斯滤波器,其中“gaussian”作为滤波器类型。
log_filter = fspecial('log', hsize, sigma);
我们使用 fspecial 函数创建高斯-拉普拉斯滤波器,其中“log”作为滤波器类型。此滤波器表示高斯滤波器的拉普拉斯算子,用于边缘检测。
filtered_img = imfilter(double(img_gray), log_filter, 'conv', 'replicate');
此处,将高斯-拉普拉斯滤波器应用于使用 imfilter 函数的灰度图像 img_gray。'conv' 选项指定应使用卷积应用滤波器,而“replicate”选项指定在滤波期间如何处理图像边界。
subplot(1, 2, 1);
imshow(img_gray);
title('Original Image');

subplot(1, 2, 2);
imshow(uint8(filtered_img));
title('Laplacian of Gaussian Filtered Image');
最后,我们使用 subplot、imshow 和 title 函数并排显示原始灰度图像和滤波后的图像。滤波后的图像在显示之前转换为 uint8 格式。
执行代码后,我们得到如下输出:

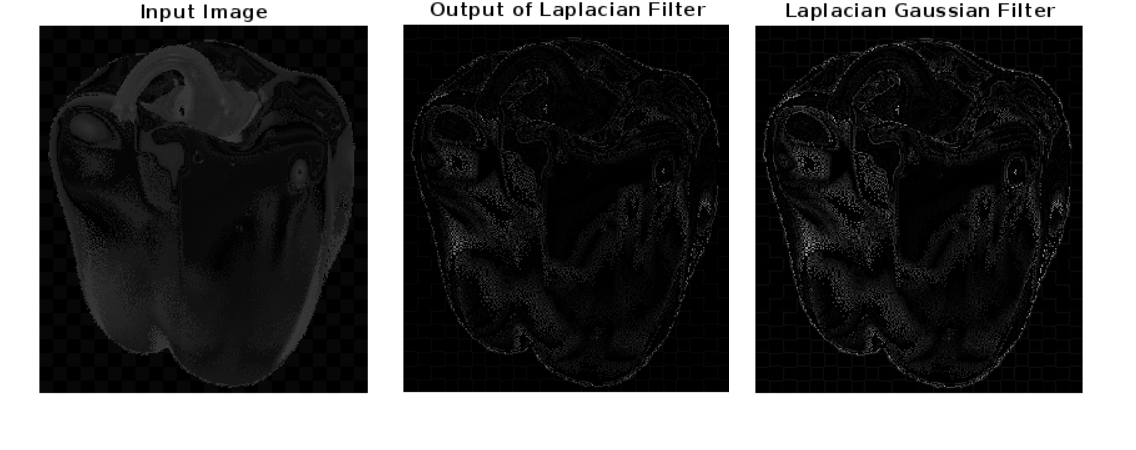
示例 2:使用拉普拉斯和 LoG 滤波器进行图像滤波
此示例显示了将两种不同的滤波器(拉普拉斯滤波器和高斯-拉普拉斯 (LoG) 滤波器)应用于输入图像“peppers.jpg”
我们的代码如下:
x=imread('peppers.jpg');
figure;
imshow(x);
title('Input Image');
figure;
h=fspecial('laplacian');
filtered_image=imfilter(x,h);
imshow(filtered_image);
title('Output of Laplacian Filter');
figure;
h=fspecial('log');
filtered_image=imfilter(x,h);
imshow(filtered_image);
title('Laplacian Gaussian Filter');
在上面的示例中:
x = imread('peppers.jpg');
figure;
imshow(x);
title('Input Image');
此代码读取图像“peppers.jpg”并使用 imshow 函数显示它。title 函数在图像图形中添加标题。
h = fspecial('laplacian');
filtered_image = imfilter(x, h);
这里,使用 fspecial 函数创建拉普拉斯滤波器,其中“laplacian”作为滤波器类型。然后使用 imfilter 函数将此滤波器应用于输入图像 x,从而产生滤波后的图像 filtered_image。
figure;
imshow(filtered_image);
title('Output of Laplacian Filter');
此代码显示从拉普拉斯滤波器获得的滤波后的图像。title 函数在图像图形中添加标题。
h = fspecial('log');
filtered_image = imfilter(x, h);
与拉普拉斯滤波器类似,使用 fspecial 函数创建 LoG 滤波器,其中“log”作为滤波器类型。然后使用 imfilter 函数将此滤波器应用于输入图像 x,从而产生滤波后的图像 filtered_image。
imshow(filtered_image);
title('Laplacian of Gaussian Filter');
此代码显示从 LoG 滤波器获得的滤波后的图像。title 函数在图像图形中添加标题。
执行代码后,我们得到如下输出:
