- 机器学习基础
- ML - 首页
- ML - 简介
- ML - 入门
- ML - 基本概念
- ML - 生态系统
- ML - Python 库
- ML - 应用
- ML - 生命周期
- ML - 必备技能
- ML - 实现
- ML - 挑战与常见问题
- ML - 限制
- ML - 真实案例
- ML - 数据结构
- ML - 数学
- ML - 人工智能
- ML - 神经网络
- ML - 深度学习
- ML - 获取数据集
- ML - 分类数据
- ML - 数据加载
- ML - 数据理解
- ML - 数据准备
- ML - 模型
- ML - 监督学习
- ML - 无监督学习
- ML - 半监督学习
- ML - 强化学习
- ML - 监督学习与无监督学习
- 机器学习数据可视化
- ML - 数据可视化
- ML - 直方图
- ML - 密度图
- ML - 箱线图
- ML - 相关矩阵图
- ML - 散点矩阵图
- 机器学习统计学
- ML - 统计学
- ML - 均值、中位数、众数
- ML - 标准差
- ML - 百分位数
- ML - 数据分布
- ML - 偏度和峰度
- ML - 偏差和方差
- ML - 假设
- 机器学习中的回归分析
- ML - 回归分析
- ML - 线性回归
- ML - 简单线性回归
- ML - 多元线性回归
- ML - 多项式回归
- 机器学习中的分类算法
- ML - 分类算法
- ML - 逻辑回归
- ML - K近邻算法 (KNN)
- ML - 朴素贝叶斯算法
- ML - 决策树算法
- ML - 支持向量机
- ML - 随机森林
- ML - 混淆矩阵
- ML - 随机梯度下降
- 机器学习中的聚类算法
- ML - 聚类算法
- ML - 基于质心的聚类
- ML - K均值聚类
- ML - K中心点聚类
- ML - 均值漂移聚类
- ML - 层次聚类
- ML - 基于密度的聚类
- ML - DBSCAN聚类
- ML - OPTICS聚类
- ML - HDBSCAN聚类
- ML - BIRCH聚类
- ML - 亲和传播
- ML - 基于分布的聚类
- ML - 凝聚层次聚类
- 机器学习中的降维
- ML - 降维
- ML - 特征选择
- ML - 特征提取
- ML - 后向消除
- ML - 前向特征构造
- ML - 高相关性过滤器
- ML - 低方差过滤器
- ML - 缺失值比率
- ML - 主成分分析
- 强化学习
- ML - 强化学习算法
- ML - 利用与探索
- ML - Q学习
- ML - REINFORCE算法
- ML - SARSA强化学习
- ML - 演员-评论家方法
- 深度强化学习
- ML - 深度强化学习
- 量子机器学习
- ML - 量子机器学习
- ML - 使用Python的量子机器学习
- 机器学习杂项
- ML - 性能指标
- ML - 自动工作流
- ML - 提升模型性能
- ML - 梯度提升
- ML - 自举汇聚 (Bagging)
- ML - 交叉验证
- ML - AUC-ROC曲线
- ML - 网格搜索
- ML - 数据缩放
- ML - 训练和测试
- ML - 关联规则
- ML - Apriori算法
- ML - 高斯判别分析
- ML - 成本函数
- ML - 贝叶斯定理
- ML - 精度和召回率
- ML - 对抗性
- ML - 堆叠
- ML - 迭代
- ML - 感知器
- ML - 正则化
- ML - 过拟合
- ML - P值
- ML - 熵
- ML - MLOps
- ML - 数据泄露
- ML - 机器学习的商业化
- ML - 数据类型
- 机器学习 - 资源
- ML - 快速指南
- ML - 速查表
- ML - 面试问题
- ML - 有用资源
- ML - 讨论
机器学习 - 均值漂移聚类
均值漂移聚类算法是一种非参数聚类算法,它通过迭代地将数据点的均值移动到数据最密集的区域来工作。数据的最密集区域由核函数确定,核函数是根据数据点到均值的距离为数据点分配权重的函数。均值漂移聚类中使用的核函数通常是高斯函数。
均值漂移聚类算法涉及的步骤如下:
将每个数据点的均值初始化为其自身的值。
对于每个数据点,计算均值漂移向量,该向量指向数据最密集的区域。
通过将每个数据点的均值移动到数据最密集的区域来更新每个数据点的均值。
重复步骤2和3,直到达到收敛。
均值漂移聚类算法是一种基于密度的聚类算法,这意味着它根据数据点的密度而不是它们之间的距离来识别聚类。换句话说,该算法根据数据点密度最高的区域来识别聚类。
在Python中实现均值漂移聚类
可以使用scikit-learn库在Python编程语言中实现均值漂移聚类算法。scikit-learn库是Python中一个流行的机器学习库,它提供了各种用于数据分析和机器学习的工具。以下步骤涉及在Python中使用scikit-learn库实现均值漂移聚类算法:
步骤1 - 导入必要的库
numpy库用于Python中的科学计算,而matplotlib库用于数据可视化。sklearn.cluster库包含MeanShift类,该类用于在Python中实现均值漂移聚类算法。
estimate_bandwidth函数用于估计核函数的带宽,这是均值漂移聚类算法中的一个重要参数。
import numpy as np
import matplotlib.pyplot as plt
from sklearn.cluster import MeanShift, estimate_bandwidth
步骤2 - 生成数据
在此步骤中,我们生成一个包含500个数据点和2个特征的随机数据集。我们使用numpy.random.randn函数生成数据。
# Generate the data
X = np.random.randn(500,2)
步骤3 - 估计核函数的带宽
在此步骤中,我们使用estimate_bandwidth函数估计核函数的带宽。带宽是均值漂移聚类算法中的一个重要参数,它确定了核函数的宽度。
# Estimate the bandwidth
bandwidth = estimate_bandwidth(X, quantile=0.1, n_samples=100)
步骤4 - 初始化均值漂移聚类算法
在此步骤中,我们使用MeanShift类初始化均值漂移聚类算法。我们将带宽参数传递给该类以设置核函数的宽度。
# Initialize the Mean-Shift algorithm
ms = MeanShift(bandwidth=bandwidth, bin_seeding=True)
步骤5 - 训练模型
在此步骤中,我们使用MeanShift类的fit方法在数据集上训练均值漂移聚类算法。
# Train the model
ms.fit(X)
步骤6 - 可视化结果
# Visualize the results
labels = ms.labels_
cluster_centers = ms.cluster_centers_
n_clusters_ = len(np.unique(labels))
print("Number of estimated clusters:", n_clusters_)

# Plot the data points and the centroids
plt.figure(figsize=(7.5, 3.5))
plt.scatter(X[:,0], X[:,1], c=labels, cmap='viridis')
plt.scatter(cluster_centers[:,0], cluster_centers[:,1], marker='*', s=300, c='r')
plt.show()
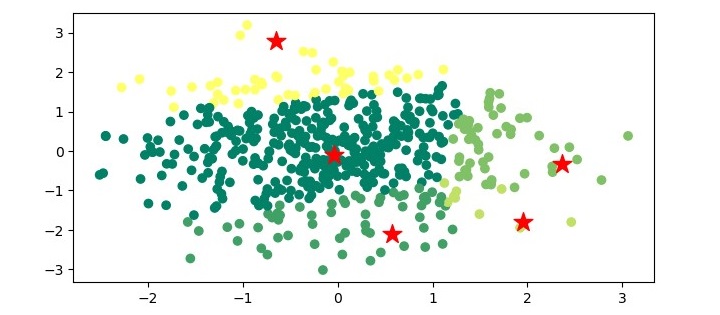
在此步骤中,我们可视化均值漂移聚类算法的结果。我们从训练好的模型中提取聚类标签和聚类中心。然后,我们打印估计的聚类数量。最后,我们使用matplotlib库绘制数据点和质心。
示例
以下是Python中均值漂移聚类算法的完整实现示例:
import numpy as np
import matplotlib.pyplot as plt
from sklearn.cluster import MeanShift, estimate_bandwidth

# Generate the data
X = np.random.randn(500,2)

# Estimate the bandwidth
bandwidth = estimate_bandwidth(X, quantile=0.1, n_samples=100)

# Initialize the Mean-Shift algorithm
ms = MeanShift(bandwidth=bandwidth, bin_seeding=True)

# Train the model
ms.fit(X)

# Visualize the results
labels = ms.labels_
cluster_centers = ms.cluster_centers_
n_clusters_ = len(np.unique(labels))
print("Number of estimated clusters:", n_clusters_)

# Plot the data points and the centroids
plt.figure(figsize=(7.5, 3.5))
plt.scatter(X[:,0], X[:,1], c=labels, cmap='summer')
plt.scatter(cluster_centers[:,0], cluster_centers[:,1], marker='*',
s=200, c='r')
plt.show()
输出
执行程序时,它将生成以下绘图作为输出:

均值漂移聚类的应用
均值漂移聚类算法在各个领域都有多种应用。均值漂移聚类的一些应用如下:
计算机视觉 - 均值漂移聚类广泛用于计算机视觉中的物体跟踪、图像分割和特征提取。
图像处理 - 均值漂移聚类用于图像分割,即根据像素的相似性将图像划分为多个片段的过程。
异常检测 - 均值漂移聚类可用于通过识别低密度区域来检测数据中的异常。
客户细分 - 均值漂移聚类可用于通过识别具有相似行为和偏好的客户群体来进行营销中的客户细分。
社交网络分析 - 均值漂移聚类可用于根据用户的兴趣和互动对社交网络中的用户进行聚类。