- Mahotas 教程
- Mahotas - 首页
- Mahotas - 简介
- Mahotas - 计算机视觉
- Mahotas - 历史
- Mahotas - 特性
- Mahotas - 安装
- Mahotas 图像处理
- Mahotas - 图像处理
- Mahotas - 加载图像
- Mahotas - 加载灰度图像
- Mahotas - 显示图像
- Mahotas - 显示图像形状
- Mahotas - 保存图像
- Mahotas - 图像质心
- Mahotas - 图像卷积
- Mahotas - 创建RGB图像
- Mahotas - 图像欧拉数
- Mahotas - 图像中零的比例
- Mahotas - 获取图像矩
- Mahotas - 图像局部最大值
- Mahotas - 图像椭圆轴
- Mahotas - 图像拉伸RGB
- Mahotas 颜色空间转换
- Mahotas - 颜色空间转换
- Mahotas - RGB转灰度转换
- Mahotas - RGB转LAB转换
- Mahotas - RGB转棕褐色
- Mahotas - RGB转XYZ转换
- Mahotas - XYZ转LAB转换
- Mahotas - XYZ转RGB转换
- Mahotas - 增加伽马校正
- Mahotas - 拉伸伽马校正
- Mahotas 标记图像函数
- Mahotas - 标记图像函数
- Mahotas - 标记图像
- Mahotas - 过滤区域
- Mahotas - 边界像素
- Mahotas - 形态学操作
- Mahotas - 形态学算子
- Mahotas - 查找图像平均值
- Mahotas - 裁剪图像
- Mahotas - 图像偏心率
- Mahotas - 叠加图像
- Mahotas - 图像圆度
- Mahotas - 调整图像大小
- Mahotas - 图像直方图
- Mahotas - 膨胀图像
- Mahotas - 腐蚀图像
- Mahotas - 分水岭
- Mahotas - 图像开运算
- Mahotas - 图像闭运算
- Mahotas - 闭合图像中的孔洞
- Mahotas - 条件膨胀图像
- Mahotas - 条件腐蚀图像
- Mahotas - 图像条件分水岭
- Mahotas - 图像局部最小值
- Mahotas - 图像区域最大值
- Mahotas - 图像区域最小值
- Mahotas - 高级概念
- Mahotas - 图像阈值化
- Mahotas - 设置阈值
- Mahotas - 软阈值
- Mahotas - Bernsen局部阈值化
- Mahotas - 小波变换
- 制作图像小波中心
- Mahotas - 距离变换
- Mahotas - 多边形工具
- Mahotas - 局部二值模式
- 阈值邻域统计
- Mahotas - Haralick特征
- 标记区域的权重
- Mahotas - Zernike特征
- Mahotas - Zernike矩
- Mahotas - 排序滤波器
- Mahotas - 2D拉普拉斯滤波器
- Mahotas - 多数滤波器
- Mahotas - 均值滤波器
- Mahotas - 中值滤波器
- Mahotas - Otsu方法
- Mahotas - 高斯滤波
- Mahotas - Hit & Miss变换
- Mahotas - 标记最大值数组
- Mahotas - 图像平均值
- Mahotas - SURF密集点
- Mahotas - SURF积分
- Mahotas - Haar变换
- 突出图像最大值
- 计算线性二值模式
- 获取标签边界
- 反转Haar变换
- Riddler-Calvard方法
- 标记区域的大小
- Mahotas - 模板匹配
- 加速鲁棒特征
- 去除边界标记
- Mahotas - Daubechies小波
- Mahotas - Sobel边缘检测
Mahotas - 显示图像
加载图像并对其执行各种操作后,您需要显示最终输出图像以查看操作结果。
显示图像指的是在屏幕上向用户或查看者直观地呈现图像数据。
在 Mahotas 中显示图像
我们可以使用 mahotas.plotting 模块中的 **imshow()** 和 **show()** 函数在 Mahotas 中显示图像。它允许我们在 Python 环境中显示图像。此函数内部使用 Matplotlib 库来渲染图像。
让我们简要讨论一下 imshow() 和 show() 函数。
使用 imshow() 函数
imshow() 函数用于在一个单独的窗口中显示图像。它创建一个新窗口并在其中渲染图像。此函数提供各种选项来自定义显示,例如调整窗口大小、颜色图和颜色范围。
语法
以下是 imshow() 函数的基本语法:
imshow(image)
其中,**'image'** 是我们要显示的图片。
使用 show() 函数
show() 函数用于显示当前图形或图像。它是 pylab 模块(Mahotas 用于绘图和可视化的 Matplotlib 库)的一部分。
当您想要在同一窗口中显示多个图像或绘图时,此函数特别有用。
语法
以下是 show() 函数的基本语法:
show()
示例
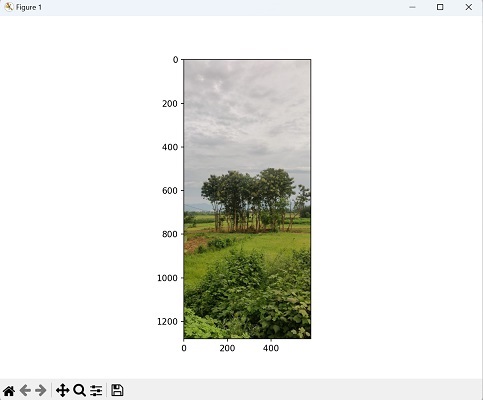
在下面的示例中,我们使用 imshow() 和 show() 函数显示当前目录中名为“nature.jpeg”的图像文件:
import mahotas as mh
from pylab import imshow, show
# Loading the image using Mahotas
image = mh.imread('nature.jpeg')
# displaying the original image
imshow(image)
show()
输出
以上代码的输出如下:
显示多张图像
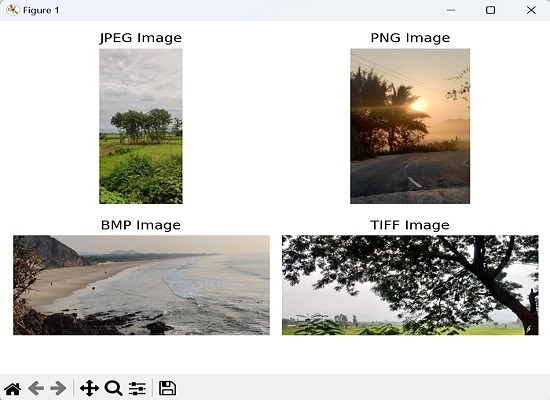
Mahotas 还允许我们同时显示多张图像。当我们想要并排比较或可视化不同的图像时,这很有用。Mahotas 提供广泛的图像格式,包括 JPEG、PNG、BMP、TIFF 和 GIF 等常用格式。因此,我们可以显示不同格式的每张图像。
图像格式是指用于数字存储和编码图像的不同文件格式。每种格式都有其自身的规范、特性和压缩方法。
示例
在此示例中,我们通过使用 imshow() 和 show() 函数显示不同格式的图像来演示 Mahotas 的多功能性。每个加载的图像都存储在一个单独的变量中:
import mahotas as ms
import matplotlib.pyplot as mtplt
# Loading JPEG image
image_jpeg = ms.imread('nature.jpeg')
# Loading PNG image
image_png = ms.imread('sun.png')
# Loading BMP image
image_bmp = ms.imread('sea.bmp')
# Loading TIFF image
image_tiff = ms.imread('tree.tiff')
# Creating a figure and subplots
fig, axes = mtplt.subplots(2, 2)
# Displaying JPEG image
axes[0, 0].imshow(image_jpeg)
axes[0, 0].axis('off')
axes[0, 0].set_title('JPEG Image')
# Displaying PNG image
axes[0, 1].imshow(image_png)
axes[0, 1].axis('off')
axes[0, 1].set_title('PNG Image')
# Displaying BMP image
axes[1, 0].imshow(image_bmp)
axes[1, 0].axis('off')
axes[1, 0].set_title('BMP Image')
# Displaying TIFF image
axes[1, 1].imshow(image_tiff)
axes[1, 1].axis('off')
axes[1, 1].set_title('TIFF Image')
# Adjusting the spacing and layout
mtplt.tight_layout()
# Showing the figure
mtplt.show()
输出
显示的图像如下:
自定义图像显示
当我们谈论在 Mahotas 中自定义图像显示时,我们指的是能够修改图像在屏幕或绘图中显示方式的各个方面。这些自定义允许我们增强图像的可视化表示并向查看者提供更多信息。
Mahotas 提供多个选项来自定义图像显示。例如,我们可以调整颜色图、添加标题和修改显示大小。
让我们逐一讨论自定义图像显示的每个选项。
应用颜色图
Mahotas 支持不同的颜色图,可以将其应用于灰度或单通道图像以增强其对比度和视觉外观。颜色图决定如何将像素值映射到颜色。
例如,“gray”颜色图通常用于灰度图像,而“hot”或“jet”颜色图可以用于强调图像中的强度变化。通过选择合适的颜色图。
要更改用于显示图像的颜色图,我们可以将 cmap 参数传递给 imshow() 函数。cmap 参数接受一个字符串,表示所需颜色图的名称。
示例
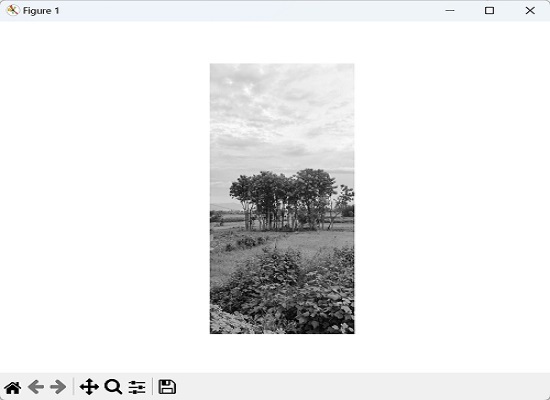
在下面的示例中,我们将 cmap 参数传递给 imshow() 函数并将其参数设置为“gray”,以使用灰度颜色图显示灰度图像:
import mahotas as ms
import matplotlib.pyplot as mtplt
# Loading grayscale image
grayscale_image = ms.imread('nature.jpeg', as_grey=True)
# Displaying grayscale image
mtplt.imshow(grayscale_image, cmap='gray')
mtplt.axis('off')
mtplt.show()
输出
执行上述代码后,我们将得到如下所示的输出:
添加标题
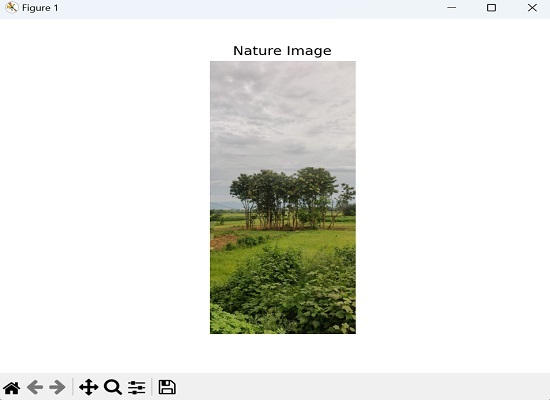
我们还可以使用传递给 imshow() 函数的 title 参数为图像添加标题或字幕。
示例
在下面的代码中,我们向显示的图像添加了标题“自然图像”:
import mahotas as ms
import matplotlib.pyplot as mtplt
# Loading the image
image = ms.imread('nature.jpeg')
# Displaying the image
mtplt.imshow(image)
mtplt.axis('off')
mtplt.title('Nature Image')
mtplt.show()
输出
以上代码的输出如下:
图形大小
Mahotas 中的图形大小指的是将显示图像的绘图或图像显示区域的大小。
我们还可以通过指定 imshow() 函数的 **figsize** 参数来控制显示图像的大小。figsize 参数需要一个元组,以英寸为单位表示图形的宽度和高度。
示例
在下面的示例中,我们将图形大小设置为 (8, 6) 英寸:
import mahotas as ms
import matplotlib.pyplot as mtplt
# Loading the image
image = ms.imread('nature.jpeg')
# Set the figure size using Matplotlib
# Specify the width and height of the figure in inches
fig = mtplt.figure(figsize=(8, 6))
# Displaying the image
mtplt.imshow(image)
mtplt.show()
输出
以上代码的输出如下:
