- Mahotas 教程
- Mahotas - 首页
- Mahotas - 简介
- Mahotas - 计算机视觉
- Mahotas - 历史
- Mahotas - 特性
- Mahotas - 安装
- Mahotas 处理图像
- Mahotas - 处理图像
- Mahotas - 加载图像
- Mahotas - 加载灰度图像
- Mahotas - 显示图像
- Mahotas - 显示图像形状
- Mahotas - 保存图像
- Mahotas - 图像的质心
- Mahotas - 图像卷积
- Mahotas - 创建 RGB 图像
- Mahotas - 图像的欧拉数
- Mahotas - 图像中零的比例
- Mahotas - 获取图像矩
- Mahotas - 图像中的局部最大值
- Mahotas - 图像椭圆轴
- Mahotas - 图像拉伸 RGB
- Mahotas 颜色空间转换
- Mahotas - 颜色空间转换
- Mahotas - RGB 到灰度转换
- Mahotas - RGB 到 LAB 转换
- Mahotas - RGB 到 Sepia 转换
- Mahotas - RGB 到 XYZ 转换
- Mahotas - XYZ 到 LAB 转换
- Mahotas - XYZ 到 RGB 转换
- Mahotas - 增加伽马校正
- Mahotas - 拉伸伽马校正
- Mahotas 标注图像函数
- Mahotas - 标注图像函数
- Mahotas - 标注图像
- Mahotas - 过滤区域
- Mahotas - 边界像素
- Mahotas - 形态学操作
- Mahotas - 形态学算子
- Mahotas - 查找图像均值
- Mahotas - 裁剪图像
- Mahotas - 图像的偏心率
- Mahotas - 叠加图像
- Mahotas - 图像的圆度
- Mahotas - 调整图像大小
- Mahotas - 图像直方图
- Mahotas - 膨胀图像
- Mahotas - 腐蚀图像
- Mahotas - 分水岭
- Mahotas - 图像开运算
- Mahotas - 图像闭运算
- Mahotas - 填充图像中的孔洞
- Mahotas - 条件膨胀图像
- Mahotas - 条件腐蚀图像
- Mahotas - 图像条件分水岭
- Mahotas - 图像中的局部最小值
- Mahotas - 图像的区域最大值
- Mahotas - 图像的区域最小值
- Mahotas - 高级概念
- Mahotas - 图像阈值化
- Mahotas - 设置阈值
- Mahotas - 软阈值
- Mahotas - Bernsen 局部阈值化
- Mahotas - 小波变换
- 制作图像小波中心
- Mahotas - 距离变换
- Mahotas - 多边形工具
- Mahotas - 局部二值模式
- 阈值邻接统计
- Mahotas - Haralic 特征
- 标注区域的权重
- Mahotas - Zernike 特征
- Mahotas - Zernike 矩
- Mahotas - 排序滤波器
- Mahotas - 2D 拉普拉斯滤波器
- Mahotas - 多数滤波器
- Mahotas - 均值滤波器
- Mahotas - 中值滤波器
- Mahotas - Otsu 方法
- Mahotas - 高斯滤波
- Mahotas - 击中与不击中变换
- Mahotas - 标注最大值数组
- Mahotas - 图像的平均值
- Mahotas - SURF 密集点
- Mahotas - SURF 积分
- Mahotas - Haar 变换
- 突出显示图像最大值
- 计算线性二值模式
- 获取标签的边界
- 反转 Haar 变换
- Riddler-Calvard 方法
- 标注区域的大小
- Mahotas - 模板匹配
- 加速鲁棒特征
- 去除带边框的标签
- Mahotas - Daubechies 小波
- Mahotas - Sobel 边缘检测
Mahotas - 显示图像形状
在处理图像数据时,有些情况下我们需要显示图像的形状。
显示图像的形状是指揭示图像的维度和特征,例如图像的宽度、高度和颜色通道;其中高度对应于行数,宽度对应于列数,通道表示图像中颜色通道的数量(例如,RGB 图像为 3)。
在 Mahotas 中显示图像形状
在 mahotas 中,我们可以使用表示图像的 NumPy 数组的 shape 属性来显示图像的形状。通过访问此属性,我们可以获得图像的维度,并根据其形状确定要执行的操作。
让我们讨论 Mahotas 提供的不同步骤和函数来提取和可视化形状信息,以及一些实际示例。
步骤 1:导入和加载图像
首先,我们需要导入 Mahotas 库并加载我们要分析的图像。Mahotas 安装完成后,我们就可以开始进行图像形状分析了。
步骤 2:显示图像的形状
要在 mahotas 中显示图像的形状,我们可以使用 NumPy 数组的 shape 属性。
shape 属性返回一个表示数组维度的整数元组。对于图像,它将提供有关其宽度、高度和通道的信息。
image_shape = image.shape
print("Image Shape:", image_shape)
这将以 (高度,宽度,通道) 的格式打印加载图像的形状。
步骤 3:提取单个维度
当我们谈论在 Mahotas 中提取形状的单个维度时,指的是获取有关图像大小和颜色分量的特定信息。
简单来说,图像具有不同的属性,例如高度、宽度和颜色通道数(例如红色、绿色和蓝色)。提取单个维度意味着分别隔离和获取这些特定的信息片段。
height = image_shape[0]
width = image_shape[1]
channels = image_shape[2]
print("Height:", height)
print("Width:", width)
print("Channels:", channels)
通过执行此代码,我们将使用索引访问图像的维度,其中:
第一个索引对应于高度,
第二个索引对应于宽度,
第三个索引对应于通道数。
这将给出图像的单个维度。
步骤 4:检查灰度图像
灰度图像是黑白图像,其中每个像素表示该特定点的强度或亮度。它没有任何颜色信息。可以把它想象成黑白照片。
有时,我们会遇到灰度图像,它们只有一个通道,而不是彩色图像通常的三个通道(红色、绿色和蓝色)。要确定图像是否是灰度图像,我们可以检查通道数是否等于 1。
is_grayscale = channels == 1
if is_grayscale:
   print("The image is grayscale.")
else:
   print("The image is not grayscale.")
通过执行此代码,您可以确定加载的图像是否为灰度图像。根据结果,我们可以继续进行相应的分析。
步骤 5:在图像上显示形状信息
现在,让我们探索如何在图像本身显示形状信息。我们可以绘制形状或添加文本叠加来突出显示特定的形状特征。这在以带注释的形状信息显示或保存图像时非常有用。
import matplotlib.pyplot as plt
# Create a figure and axes
fig, ax = plt.subplots()
# Display the image
ax.imshow(image)
# Add text for shape information
ax.text(10, 20, f"Shape: {image_shape}", color='white', fontsize=10,
bbox=dict(facecolor='black'))
# Remove axis ticks
ax.set_xticks([])
ax.set_yticks([])
# Show the figure
plt.show()
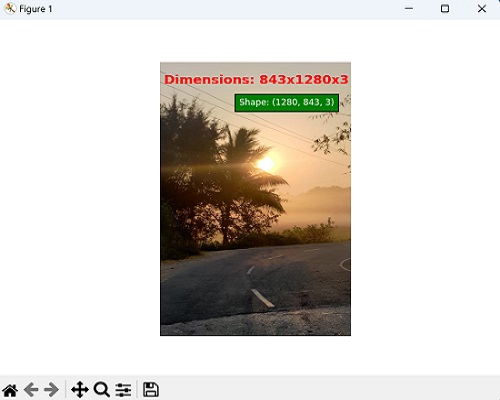
当我们执行此代码时,它将显示图像,并在其上叠加形状信息。形状信息将位于指定坐标处,文本将以白色显示在黑色边框上,使其在图像上更易于查看。
完整示例
现在,让我们看看包含上面讨论的所有步骤的完整代码 -
# Installing the library
import mahotas as ms
import matplotlib.pyplot as mtplt
# Loading the image
image = ms.imread('sun.png')
# Displaying the shape of an image
image_shape = image.shape
print("Image Shape:", image_shape)
# Extracting individual dimensions
height = image_shape[0]
width = image_shape[1]
channels = image_shape[2]
print("Height:", height)
print("Width:", width)
print("Channels:", channels)
# Checking if the image is grayscale
is_grayscale = channels == 1
if is_grayscale:
   print("The image is grayscale.")
else:
   print("The image is not grayscale.")
# Create a figure and axis
fig, ax = mtplt.subplots()
# Display the image
ax.imshow(image)
# Add text for shape information
ax.text(350, 200, f"Shape: {image_shape}", color='white', fontsize=8,
bbox=dict(facecolor='green'))
# Remove axis ticks
ax.set_xticks([])
ax.set_yticks([])
# Display the image
ax.imshow(image)
# Add text overlay for dimensions
text = f"Dimensions: {width}x{height}x{channels}" if not is_grayscale else
f"Dimensions: {width}x{height} (Grayscale)"
ax.text(18, 100, text, color='red', fontsize=12, fontweight='bold')
# Remove axis ticks and labels
ax.axis('off')
# Show the image with shape information
mtplt.show()
输出
执行上述代码后,我们将获得以下输出 -
Image Shape: (1280, 843, 3)
Height: 1280
Width: 843
Channels: 3
The image is not grayscale.