- Mahotas 教程
- Mahotas - 首页
- Mahotas - 简介
- Mahotas - 计算机视觉
- Mahotas - 历史
- Mahotas - 特性
- Mahotas - 安装
- Mahotas 处理图像
- Mahotas - 处理图像
- Mahotas - 加载图像
- Mahotas - 加载灰度图像
- Mahotas - 显示图像
- Mahotas - 显示图像形状
- Mahotas - 保存图像
- Mahotas - 图像的质心
- Mahotas - 图像卷积
- Mahotas - 创建 RGB 图像
- Mahotas - 图像的欧拉数
- Mahotas - 图像中零的比例
- Mahotas - 获取图像矩
- Mahotas - 图像中的局部最大值
- Mahotas - 图像椭圆轴
- Mahotas - 图像拉伸 RGB
- Mahotas 颜色空间转换
- Mahotas - 颜色空间转换
- Mahotas - RGB 到灰度转换
- Mahotas - RGB 到 LAB 转换
- Mahotas - RGB 到 Sepia 转换
- Mahotas - RGB 到 XYZ 转换
- Mahotas - XYZ 到 LAB 转换
- Mahotas - XYZ 到 RGB 转换
- Mahotas - 增加伽马校正
- Mahotas - 拉伸伽马校正
- Mahotas 标签图像函数
- Mahotas - 标签图像函数
- Mahotas - 标注图像
- Mahotas - 过滤区域
- Mahotas - 边界像素
- Mahotas - 形态学操作
- Mahotas - 形态学算子
- Mahotas - 查找图像平均值
- Mahotas - 裁剪图像
- Mahotas - 图像的偏心率
- Mahotas - 图像叠加
- Mahotas - 图像的圆度
- Mahotas - 调整图像大小
- Mahotas - 图像直方图
- Mahotas - 膨胀图像
- Mahotas - 腐蚀图像
- Mahotas - 分水岭算法
- Mahotas - 图像开运算
- Mahotas - 图像闭运算
- Mahotas - 填充图像孔洞
- Mahotas - 条件膨胀图像
- Mahotas - 条件腐蚀图像
- Mahotas - 图像条件分水岭
- Mahotas - 图像中的局部最小值
- Mahotas - 图像的区域最大值
- Mahotas - 图像的区域最小值
- Mahotas - 高级概念
- Mahotas - 图像阈值化
- Mahotas - 设置阈值
- Mahotas - 软阈值
- Mahotas - Bernsen 局部阈值化
- Mahotas - 小波变换
- 制作图像小波中心
- Mahotas - 距离变换
- Mahotas - 多边形实用程序
- Mahotas - 局部二值模式
- 阈值邻域统计
- Mahotas - Haralick 特征
- 标记区域的权重
- Mahotas - Zernike 特征
- Mahotas - Zernike 矩
- Mahotas - 排序滤波器
- Mahotas - 2D 拉普拉斯滤波器
- Mahotas - 多数滤波器
- Mahotas - 均值滤波器
- Mahotas - 中值滤波器
- Mahotas - Otsu 方法
- Mahotas - 高斯滤波
- Mahotas - 击中击不中变换
- Mahotas - 标记最大数组
- Mahotas - 图像平均值
- Mahotas - SURF 密集点
- Mahotas - SURF 积分
- Mahotas - Haar 变换
- 突出显示图像最大值
- 计算线性二值模式
- 获取标签的边界
- 反转 Haar 变换
- Riddler-Calvard 方法
- 标记区域的大小
- Mahotas - 模板匹配
- 加速鲁棒特征
- 去除带边框的标签
- Mahotas - Daubechies 小波
- Mahotas - Sobel 边缘检测
Mahotas - 图像平均值
图像的平均值指的是图像所有像素的平均亮度。亮度是图像的一种属性,决定了图像在人眼看来是明亮还是暗淡。
它由像素强度值决定;较高的像素强度值表示较亮的区域,而较低的像素强度值表示较暗的区域。
图像的平均值广泛用于图像分割,图像分割涉及将图像划分为不同的区域。
它也可以用于图像阈值化,图像阈值化指的是将图像转换为包含前景和背景像素的二值图像。
Mahotas 中的图像平均值
Mahotas 没有内置函数来查找图像的平均值。但是,我们可以使用 mahotas 和 numpy 库一起查找图像的平均值。
我们可以使用 numpy 库中的 mean() 函数来查找图像的平均像素强度值。
mean() 函数的工作原理是迭代遍历每个像素并将其强度值求和。遍历完所有像素后,它将总和除以像素总数。
可以使用以下公式计算图像的平均像素强度值:
Mean = Sum of all pixel values / Total number of pixels
例如,假设一个图像由 2 个像素组成,每个像素的强度值为 5。然后可以按如下方式计算平均值:
Mean = 10 / 2
Mean = 5
numpy.mean() 函数
numpy.mean() 函数以图像作为输入,并将其所有像素的平均亮度作为十进制数返回。mean 函数适用于任何类型的输入图像,例如 RGB、灰度或标记图像。
语法
以下是 numpy 中 mean() 函数的基本语法:
numpy.mean(image)
其中,
image - 它是要输入的图像。
示例
在以下示例中,我们使用 np.mean() 函数查找图像的平均像素强度值。
import mahotas as mh
import numpy as np
import matplotlib.pyplot as mtplt
# Loading the image
image = mh.imread('sun.png')
# Finding the mean value
mean_value = np.mean(image)
# Printing the mean value
print('Mean value of the image is =', mean_value)
# Creating a figure and axes for subplots
fig, axes = mtplt.subplots(1, 1)
# Displaying the original image
axes.imshow(image)
axes.set_title('Original Image')
axes.set_axis_off()
# Adjusting spacing between subplots
mtplt.tight_layout()
# Showing the figures
mtplt.show()
输出
以下是上述代码的输出:
Mean value of the image is = 105.32921300415184
获得的图像如下所示:

每个通道的平均值
我们还可以找到 Mahotas 中 RGB 图像每个通道的平均值。RGB 图像指的是具有三个颜色通道的图像:红色、绿色和蓝色。
RGB 图像中的每个像素都有三个强度值,每个颜色通道一个。
红色的通道值为 0,绿色的通道值为 1,蓝色的通道值为 2。这些值可用于将 RGB 图像分离成其各个颜色分量。
在 mahotas 中,要查找 RGB 图像每个通道的平均像素强度值,我们首先将 RGB 图像分离成单独的通道。这是通过指定通道值来实现的。分离通道后,我们可以分别找到它们的平均值。
示例
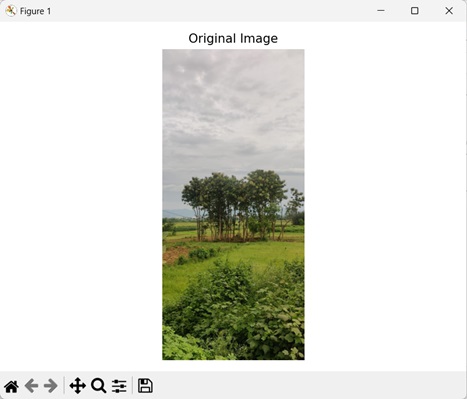
在下面提到的示例中,我们正在查找 RGB 图像每个通道的平均像素强度值。
import mahotas as mh
import numpy as np
import matplotlib.pyplot as mtplt
# Loading the image
image = mh.imread('nature.jpeg')
# Getting the red channel.
red_channel = image[:, :, 0]
# Getting the green channel.
green_channel = image[:, :, 1]
# Getting the blue channel.
blue_channel = image[:, :, 2]
# Finding the mean value of each channel
mean_red = np.mean(red_channel)
mean_green = np.mean(green_channel)
mean_blue = np.mean(blue_channel)
# Printing the mean value of each channel
print('Mean value of the Red channel is =', mean_red)
print('Mean value of the Green channel is =', mean_green)
print('Mean value of the Blue channel is =', mean_blue)
# Creating a figure and axes for subplots
fig, axes = mtplt.subplots(1, 1)
# Displaying the original image
axes.imshow(image)
axes.set_title('Original Image')
axes.set_axis_off()
# Adjusting spacing between subplots
mtplt.tight_layout()
# Showing the figures
mtplt.show()
输出
上述代码的输出如下:
Mean value of the Red channel is = 135.4501688464837
Mean value of the Green channel is = 139.46532482847343
Mean value of the Blue channel is = 109.7802007397084
生成的图像如下:
灰度图像的平均值
我们还可以找到灰度图像的平均值。灰度图像指的是只有一个颜色通道的图像。
灰度图像的每个像素都由单个强度值表示。
灰度图像的强度值范围从 0(黑色)到 255(白色)。0 到 255 之间的任何值都会产生灰色阴影。较低的值会产生较暗的阴影,而较高的值会产生较亮的阴影。
在 mahotas 中,我们首先使用 mh.colors.rgb2gray() 函数将输入 RGB 图像转换为灰度。然后,我们使用 mean() 函数找到其平均像素强度值。
示例
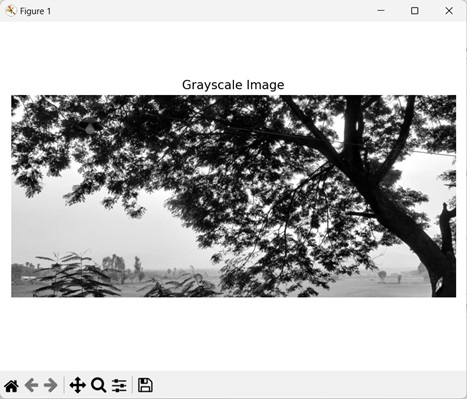
在此示例中,我们正在查找灰度图像的平均像素强度值。
import mahotas as mh
import numpy as np
import matplotlib.pyplot as mtplt
# Loading the image
image = mh.imread('tree.tiff')
# Converting it to grayscale
grayscale_image = mh.colors.rgb2gray(image)
# Finding the mean value of the grayscale image
mean_value = np.mean(grayscale_image)
# Printing the mean value of the image
print('Mean value of the grayscale image is =', mean_value)
# Creating a figure and axes for subplots
fig, axes = mtplt.subplots(1, 1)
# Displaying the grayscale image
axes.imshow(grayscale_image, cmap='gray')
axes.set_title('Grayscale Image')
axes.set_axis_off()
# Adjusting spacing between subplots
mtplt.tight_layout()
# Showing the figures
mtplt.show()
输出
执行上述代码后,我们得到以下输出:
Mean value of the grayscale image is = 113.21928107579335
以下是获得的图像: