- Mahotas 教程
- Mahotas - 首页
- Mahotas - 简介
- Mahotas - 计算机视觉
- Mahotas - 历史
- Mahotas - 特性
- Mahotas - 安装
- Mahotas 图像处理
- Mahotas - 图像处理
- Mahotas - 加载图像
- Mahotas - 以灰度加载图像
- Mahotas - 显示图像
- Mahotas - 显示图像形状
- Mahotas - 保存图像
- Mahotas - 图像质心
- Mahotas - 图像卷积
- Mahotas - 创建RGB图像
- Mahotas - 图像欧拉数
- Mahotas - 图像中零的比例
- Mahotas - 获取图像矩
- Mahotas - 图像局部最大值
- Mahotas - 图像椭圆轴
- Mahotas - 图像RGB拉伸
- Mahotas 颜色空间转换
- Mahotas - 颜色空间转换
- Mahotas - RGB到灰度转换
- Mahotas - RGB到LAB转换
- Mahotas - RGB到褐色转换
- Mahotas - RGB到XYZ转换
- Mahotas - XYZ到LAB转换
- Mahotas - XYZ到RGB转换
- Mahotas - 增加伽马校正
- Mahotas - 伽马校正拉伸
- Mahotas 标签图像函数
- Mahotas - 标签图像函数
- Mahotas - 图像标记
- Mahotas - 过滤区域
- Mahotas - 边界像素
- Mahotas - 形态学运算
- Mahotas - 形态学算子
- Mahotas - 求图像均值
- Mahotas - 裁剪图像
- Mahotas - 图像离心率
- Mahotas - 图像叠加
- Mahotas - 图像圆度
- Mahotas - 图像缩放
- Mahotas - 图像直方图
- Mahotas - 图像膨胀
- Mahotas - 图像腐蚀
- Mahotas - 分水岭算法
- Mahotas - 图像开运算
- Mahotas - 图像闭运算
- Mahotas - 填充图像空洞
- Mahotas - 条件膨胀图像
- Mahotas - 条件腐蚀图像
- Mahotas - 图像条件分水岭算法
- Mahotas - 图像局部最小值
- Mahotas - 图像区域最大值
- Mahotas - 图像区域最小值
- Mahotas - 高级概念
- Mahotas - 图像阈值化
- Mahotas - 设置阈值
- Mahotas - 软阈值
- Mahotas - Bernsen局部阈值化
- Mahotas - 小波变换
- 制作图像小波中心
- Mahotas - 距离变换
- Mahotas - 多边形工具
- Mahotas - 局部二值模式
- 阈值邻域统计
- Mahotas - Haralic特征
- 标记区域的权重
- Mahotas - Zernike特征
- Mahotas - Zernike矩
- Mahotas - 排序滤波器
- Mahotas - 二维拉普拉斯滤波器
- Mahotas - 多数滤波器
- Mahotas - 均值滤波器
- Mahotas - 中值滤波器
- Mahotas - Otsu方法
- Mahotas - 高斯滤波
- Mahotas - Hit & Miss变换
- Mahotas - 标记最大值数组
- Mahotas - 图像均值
- Mahotas - SURF密集点
- Mahotas - SURF积分图像
- Mahotas - Haar变换
- 突出显示图像最大值
- 计算线性二值模式
- 获取标签边界
- 反转Haar变换
- Riddler-Calvard方法
- 标记区域的大小
- Mahotas - 模板匹配
- 加速鲁棒特征
- 移除带边界的标记
- Mahotas - Daubechies小波
- Mahotas - Sobel边缘检测
Mahotas - 伽马校正拉伸
伽马校正拉伸是指增强图像的整体对比度。这是通过增加伽马值来实现的,伽马值增加会扩展图像像素的强度级别范围。
伽马校正拉伸的过程涉及将原始输入值拉伸到新的更宽的取值范围。
在Mahotas中进行伽马校正拉伸
在Mahotas中,我们可以使用mahotas.stretch()函数进行图像的伽马校正拉伸。
在伽马校正中,大于1的伽马值会增加图像的对比度,而小于1的伽马值会降低对比度。
因此,通过拉伸伽马值,图像的暗区会变得更暗,亮区会变得更亮,从而在不同的色调和细节之间产生更明显的区别。
使用mahotas.stretch()函数
mahotas.stretch()函数接收图像作为输入,并返回图像的锐化版本作为输出。生成的图像具有增强的对比度和改进的细节可见性。
stretch()函数确定图像中的最小和最大强度值,并将它们转换为全范围的像素值(对于8位图像为0-255)。
语法
以下是Mahotas中mh.stretch()函数的基本语法:
mahotas.stretch(img, arg0=None, arg1=None, dtype=<class 'numpy.uint8'>)
其中,
image - 输入图像。
arg0 (可选) - 输出的最小值(默认值为0)。
arg1 (可选) - 输出的最大值(默认值为255)。
dtype (可选) - 输出图像的数据类型(默认为uint8)。
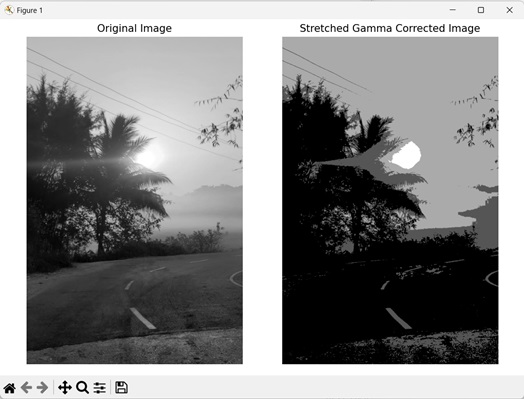
示例
在下面的示例中,我们使用mh.stretch()函数来增加灰度图像的对比度:
import mahotas as mh
import numpy as np
import matplotlib.pyplot as mtplt
# Loading the image
image = mh.imread('sun.png')
# Converting to grayscale
gray_image = mh.colors.rgb2gray(image)
# Decreasing gamma value
corrected_gamma = 3.2
# Applying stretch gamma correction image
stretch_gamma_corrected = mh.stretch(gray_image, corrected_gamma)
# Creating a figure and axes for subplots
fig, axes = mtplt.subplots(1, 2)
# Displaying the original image
axes[0].imshow(gray_image, cmap='gray')
axes[0].set_title('Original Image')
axes[0].set_axis_off()
# Displaying Stretched gamma corrected image
axes[1].imshow(stretch_gamma_corrected, cmap='gray')
axes[1].set_title('Stretched Gamma Corrected Image')
axes[1].set_axis_off()
# Adjusting spacing between subplots
mtplt.tight_layout()
# Showing the figures
mtplt.show()
输出
以下是上述代码的输出:
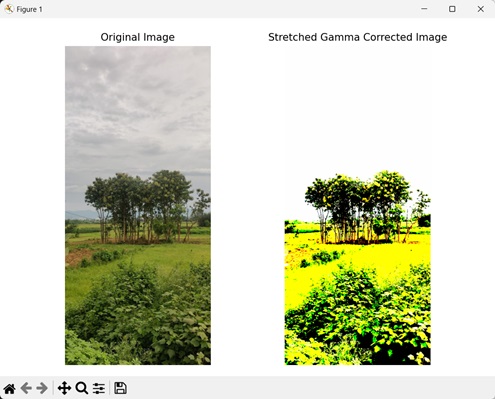
RGB图像的伽马校正拉伸
我们也可以使用stretch()函数在mahotas中对RGB图像执行伽马校正拉伸。stretch函数中使用的伽马值决定了对比度增强的程度。
然后,我们可以通过将其乘以255(RGB图像的最大强度)将其拉伸的图像转换回RGB颜色空间。
示例
以下示例显示了增加RGB图像对比度的方法:
import mahotas as mh
import numpy as np
import matplotlib.pyplot as mtplt
# Loading the image
image = mh.imread('nature.jpeg')
# Applying stretched gamma correction
stretched_gamma_corrected = mh.stretch(image, 3)
# Converting the image back to RGB
stretched_gamma_corrected = stretched_gamma_corrected * 255
# Creating subplots to display images
fig, axes = mtplt.subplots(1, 2)
# Displaying the original RGB image
axes[0].imshow(image)
axes[0].set_title('Original Image')
axes[0].set_axis_off()
# Displaying the stretched image
axes[1].imshow(stretched_gamma_corrected)
axes[1].set_title('Stretched Gamma Corrected Image')
axes[1].set_axis_off()
# Adjusting spacing between subplots
mtplt.tight_layout()
# Showing the figures
mtplt.show()
输出
上述代码的输出如下:
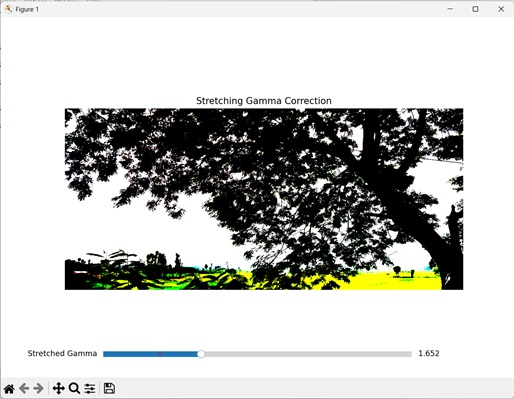
交互式伽马校正拉伸滑块
交互式伽马校正拉伸滑块是一个GUI元素,允许用户通过拖动滑块来动态调整伽马值以更改对比度。
- 要在Mahotas中使用交互式滑块进行伽马校正拉伸,首先创建一个用于调整伽马值的滑块。
- 然后,实现一个函数,在移动滑块时检索新的伽马值并将其应用于图像的伽马校正拉伸。
- 最后,将函数连接到滑块的值更改事件,以便在移动滑块时自动调用它。
语法
以下是创建交互式滑块的基本语法:
from matplotlib.widgets import Slider
Slider(slider_axis, name, min_value, max_value, valint)
其中,
slider_axis - 定义滑块位置和尺寸的列表。
name - 滑块的名称。
mini_value - 滑块可以到达的最小值。
max_value - 滑块可以到达的最大值。
valint - 滑块的起始值。
示例
在这个例子中,我们使用交互式滑块来增加对比度:
import mahotas as mh
import numpy as np
import matplotlib.pyplot as mtplt
from matplotlib.widgets import Slider
# Loading the image
image = mh.imread('tree.tiff')
# Creating a figure and axes for the plot
fig, axis = mtplt.subplots()
# Displaying the original image
axis.imshow(image)
axis.set_title('Stretching Gamma Correction')
axis.set_axis_off()
# Creating a slider for stretched gamma adjustment
slider_axis = mtplt.axes([0.2, 0.05, 0.6, 0.03])
stretched_gamma_slider = Slider(slider_axis, 'Stretched Gamma', 0.1, 5.0,
valinit=1.0)
# Updating the stretched gamma correction and plot on change of slider value
def update_stretched_gamma(val):
   stretched_gamma = stretched_gamma_slider.val
   corrected_image = mh.stretch(image, stretched_gamma)
   corrected_image = corrected_image * 255
   axis.imshow(corrected_image)
   fig.canvas.draw_idle()
stretched_gamma_slider.on_changed(update_stretched_gamma)
# Showing the figure
mtplt.show()
输出
生成的输出如下: