- Mahotas 教程
- Mahotas - 首页
- Mahotas - 简介
- Mahotas - 计算机视觉
- Mahotas - 历史
- Mahotas - 特性
- Mahotas - 安装
- Mahotas 处理图像
- Mahotas - 处理图像
- Mahotas - 加载图像
- Mahotas - 加载图像为灰度
- Mahotas - 显示图像
- Mahotas - 显示图像形状
- Mahotas - 保存图像
- Mahotas - 图像的质心
- Mahotas - 图像卷积
- Mahotas - 创建 RGB 图像
- Mahotas - 图像的欧拉数
- Mahotas - 图像中零的比例
- Mahotas - 获取图像矩
- Mahotas - 图像中的局部最大值
- Mahotas - 图像椭圆轴
- Mahotas - 图像拉伸 RGB
- Mahotas 颜色空间转换
- Mahotas - 颜色空间转换
- Mahotas - RGB 到灰度转换
- Mahotas - RGB 到 LAB 转换
- Mahotas - RGB 到 Sepia 转换
- Mahotas - RGB 到 XYZ 转换
- Mahotas - XYZ 到 LAB 转换
- Mahotas - XYZ 到 RGB 转换
- Mahotas - 增加伽马校正
- Mahotas - 拉伸伽马校正
- Mahotas 标记图像函数
- Mahotas - 标记图像函数
- Mahotas - 标记图像
- Mahotas - 过滤区域
- Mahotas - 边界像素
- Mahotas - 形态学操作
- Mahotas - 形态学算子
- Mahotas - 查找图像均值
- Mahotas - 裁剪图像
- Mahotas - 图像的偏心率
- Mahotas - 叠加图像
- Mahotas - 图像的圆度
- Mahotas - 调整图像大小
- Mahotas - 图像直方图
- Mahotas - 膨胀图像
- Mahotas - 腐蚀图像
- Mahotas - 分水岭
- Mahotas - 图像的开运算
- Mahotas - 图像的闭运算
- Mahotas - 填充图像中的孔洞
- Mahotas - 条件膨胀图像
- Mahotas - 条件腐蚀图像
- Mahotas - 图像的条件分水岭
- Mahotas - 图像中的局部最小值
- Mahotas - 图像的区域最大值
- Mahotas - 图像的区域最小值
- Mahotas - 高级概念
- Mahotas - 图像阈值化
- Mahotas - 设置阈值
- Mahotas - 软阈值
- Mahotas - Bernsen 局部阈值化
- Mahotas - 小波变换
- 制作图像小波中心
- Mahotas - 距离变换
- Mahotas - 多边形实用程序
- Mahotas - 局部二值模式
- 阈值邻域统计
- Mahotas - Haralic 特征
- 标记区域的权重
- Mahotas - Zernike 特征
- Mahotas - Zernike 矩
- Mahotas - 排序滤波器
- Mahotas - 2D 拉普拉斯滤波器
- Mahotas - 多数滤波器
- Mahotas - 均值滤波器
- Mahotas - 中值滤波器
- Mahotas - Otsu 方法
- Mahotas - 高斯滤波
- Mahotas - 击中与错过变换
- Mahotas - 标记最大数组
- Mahotas - 图像的平均值
- Mahotas - SURF 密集点
- Mahotas - SURF 积分
- Mahotas - Haar 变换
- 突出显示图像最大值
- 计算线性二值模式
- 获取标签的边界
- 反转 Haar 变换
- Riddler-Calvard 方法
- 标记区域的大小
- Mahotas - 模板匹配
- 加速鲁棒特征
- 去除带边框的标记
- Mahotas - Daubechies 小波
- Mahotas - Sobel 边缘检测
Mahotas - 击中与错过变换
击中与错过变换是一种二进制形态学运算,用于检测图像中的特定模式或形状。
该运算将结构元素与输入二值图像进行比较。结构元素由以特定模式排列的前景 (1) 和背景 (0) 像素组成,这些像素代表要检测的所需形状或模式。
击中或错过变换在结构元素和图像之间执行逐像素逻辑与运算,然后检查结果是否与预定义条件匹配。
该条件指定匹配模式中应该存在的特定前景和背景像素排列。如果满足该条件,则输出像素设置为 1,表示匹配;否则,设置为 0。
Mahotas 中的击中与错过变换
在 Mahotas 中,我们可以使用mahotas.hitmiss()函数对图像执行击中与错过变换。该函数使用结构元素'Bc'来确定输入图像中是否存在特定模式。
Mahotas 中的结构元素可以取三个值:0、1 或 2。值为 1 表示结构元素的前景,而 0 表示背景。
值 2 用作“不关心”值,这意味着不应对该特定像素执行匹配。
为了识别匹配,结构元素的值必须与输入图像中相应的像素值重叠。
如果重叠满足结构元素指定的条件,则该像素被视为匹配。
mahotas.hitmiss() 函数
mahotas.hitmiss() 以灰度图像作为输入,并返回二值图像作为输出。白色像素表示结构元素与输入图像匹配的区域,而黑色像素表示不匹配的区域。
语法
以下是 mahotas 中 hitmiss() 函数的基本语法:
mahotas.hitmiss(input, Bc, out=np.zeros_like(input))
其中,
input - 输入灰度图像。
Bc - 需要在输入图像中匹配的模式。它可以是 0、1 或 2。
out(可选) - 定义在哪个数组中存储输出图像(默认为与输入相同大小)。
示例
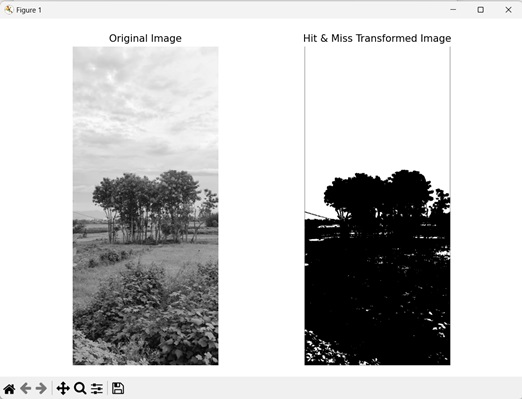
以下示例演示了使用 mh.hitmiss() 函数对图像进行击中与错过变换。
import mahotas as mh
import numpy as np
import matplotlib.pyplot as mtplt
# Loading the image
image = mh.imread('tree.tiff')
# Converting it to grayscale
image = mh.colors.rgb2gray(image)
# Applying thresholding
threshold_image = mh.thresholding.bernsen(image, 5, 200)
# Creating hit & miss template
template = np.array([[1, 2, 1, 2, 1],[2, 1, 1, 1, 2],[2, 2, 1, 2, 2]])
# Applying hit & miss transformation
hit_miss = mh.hitmiss(threshold_image, template)
# Creating a figure and axes for subplots
fig, axes = mtplt.subplots(1, 2)
# Displaying the original image
axes[0].imshow(image, cmap='gray')
axes[0].set_title('Original Image')
axes[0].set_axis_off()
# Displaying the hit & miss transformed image
axes[1].imshow(hit_miss, cmap='gray')
axes[1].set_title('Hit & Miss Transformed Image')
axes[1].set_axis_off()
# Adjusting spacing between subplots
mtplt.tight_layout()
# Showing the figures
mtplt.show()
输出
以下是上述代码的输出:
通过检测边缘
我们还可以通过应用击中与错过变换来检测图像的边缘。边缘表示图像中不同区域之间的边界。
这些是相邻像素之间强度值差异较大的区域。
在 mahotas 中,要使用击中与错过变换检测边缘,我们首先创建一个结构元素。此结构元素将模板的边缘与输入图像进行匹配。
然后,我们对图像执行阈值化,然后将结构元素作为Bc参数传递给 hitmiss() 函数。
例如,以下结构元素可用于检测输入图像中的边缘:
[[1, 2, 1]
 [2, 2, 2]
 [1, 2, 1]]
在此,1 位于结构元素的右上角、左上角、右下角和左下角位置。边缘通常位于图像中的这些位置。
结构元素中的 1 与图像中强度值为 1 的像素匹配,从而突出显示边缘作为前景。
示例
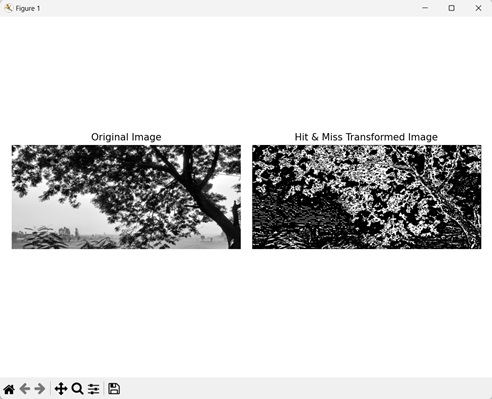
在此示例中,我们尝试通过应用击中与错过变换来检测图像的边缘:
import mahotas as mh
import numpy as np
import matplotlib.pyplot as mtplt
# Loading the image
image = mh.imread('nature.jpeg')
# Converting it to grayscale
image = mh.colors.rgb2gray(image).astype(np.uint8)
# Applying thresholding
threshold_value = mh.thresholding.rc(image)
threshold_image = image > threshold_value
# Creating hit & miss template
template = np.array([[1, 2, 1],[2, 2, 2],[1, 2, 1]])
# Applying hit & miss transformation
hit_miss = mh.hitmiss(threshold_image, template)
# Creating a figure and axes for subplots
fig, axes = mtplt.subplots(1, 2)
# Displaying the original image
axes[0].imshow(image, cmap='gray')
axes[0].set_title('Original Image')
axes[0].set_axis_off()
# Displaying the hit & miss transformed image
axes[1].imshow(hit_miss, cmap='gray')
axes[1].set_title('Hit & Miss Transformed Image')
axes[1].set_axis_off()
# Adjusting spacing between subplots
mtplt.tight_layout()
# Showing the figures
mtplt.show()
输出
上述代码的输出如下:
通过检测对角线
我们也可以使用击中与错过变换来检测图像的对角线。对角线由连接图像相对角的线性图案指示。
这些是像素强度沿对角线路径变化的区域。
在 mahotas 中,我们首先对输入图像执行阈值化。然后,我们将结构元素作为Bc参数传递给 hitmiss() 函数。此结构元素将模板的对角线与输入图像的对角线进行匹配。
例如,以下结构元素可用于检测输入图像中的对角线:
[[0, 2, 0]
 [2, 0, 2]
 [0, 2, 0]]
在此,0 沿从左上角到右下角的对角线路径运行,以及从右上角到左下角的对角线路径运行。对角线通常位于图像中的这些位置。
结构元素中的 0 与图像中强度值为 0 的像素匹配,从而突出显示对角线作为背景。
示例
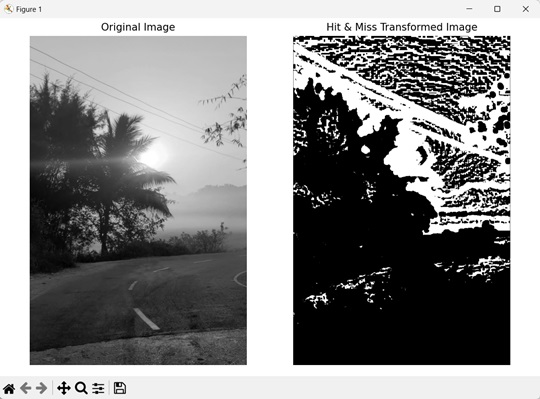
在这里,我们尝试使用击中与错过变换来检测图像的对角线:
import mahotas as mh
import numpy as np
import matplotlib.pyplot as mtplt
# Loading the image
image = mh.imread('sun.png')
# Converting it to grayscale
image = mh.colors.rgb2gray(image)
# Applying thresholding
threshold_image = mh.thresholding.bernsen(image, 10, 10)
# Creating hit & miss template
template = np.array([[0, 2, 0],[2, 0, 2],[0, 2, 0]])
# Applying hit & miss transformation
hit_miss = mh.hitmiss(threshold_image, template)
# Creating a figure and axes for subplots
fig, axes = mtplt.subplots(1, 2)
# Displaying the original image
axes[0].imshow(image, cmap='gray')
axes[0].set_title('Original Image')
axes[0].set_axis_off()
# Displaying the hit & miss transformed image
axes[1].imshow(hit_miss, cmap='gray')
axes[1].set_title('Hit & Miss Transformed Image')
axes[1].set_axis_off()
# Adjusting spacing between subplots
mtplt.tight_layout()
# Showing the figures
mtplt.show()
输出
执行上述代码后,我们将获得以下输出: