- Mahotas 教程
- Mahotas - 首页
- Mahotas - 简介
- Mahotas - 计算机视觉
- Mahotas - 历史
- Mahotas - 特性
- Mahotas - 安装
- Mahotas 处理图像
- Mahotas - 处理图像
- Mahotas - 加载图像
- Mahotas - 加载图像为灰度
- Mahotas - 显示图像
- Mahotas - 显示图像形状
- Mahotas - 保存图像
- Mahotas - 图像的质心
- Mahotas - 图像卷积
- Mahotas - 创建 RGB 图像
- Mahotas - 图像的欧拉数
- Mahotas - 图像中零的比例
- Mahotas - 获取图像矩
- Mahotas - 图像中的局部最大值
- Mahotas - 图像椭圆轴
- Mahotas - 图像拉伸 RGB
- Mahotas 颜色空间转换
- Mahotas - 颜色空间转换
- Mahotas - RGB 到灰度转换
- Mahotas - RGB 到 LAB 转换
- Mahotas - RGB 到 Sepia 转换
- Mahotas - RGB 到 XYZ 转换
- Mahotas - XYZ 到 LAB 转换
- Mahotas - XYZ 到 RGB 转换
- Mahotas - 增加伽马校正
- Mahotas - 拉伸伽马校正
- Mahotas 标记图像函数
- Mahotas - 标记图像函数
- Mahotas - 标记图像
- Mahotas - 过滤区域
- Mahotas - 边界像素
- Mahotas - 形态学运算
- Mahotas - 形态学算子
- Mahotas - 查找图像平均值
- Mahotas - 裁剪图像
- Mahotas - 图像的偏心率
- Mahotas - 叠加图像
- Mahotas - 图像的圆度
- Mahotas - 调整图像大小
- Mahotas - 图像的直方图
- Mahotas - 膨胀图像
- Mahotas - 腐蚀图像
- Mahotas - 分水岭
- Mahotas - 图像上的开运算
- Mahotas - 图像上的闭运算
- Mahotas - 填充图像中的孔洞
- Mahotas - 条件膨胀图像
- Mahotas - 条件腐蚀图像
- Mahotas - 图像的条件分水岭
- Mahotas - 图像中的局部最小值
- Mahotas - 图像的区域最大值
- Mahotas - 图像的区域最小值
- Mahotas - 高级概念
- Mahotas - 图像阈值化
- Mahotas - 设置阈值
- Mahotas - 软阈值
- Mahotas - Bernsen 局部阈值化
- Mahotas - 小波变换
- 制作图像小波中心
- Mahotas - 距离变换
- Mahotas - 多边形实用程序
- Mahotas - 局部二值模式
- 阈值邻域统计
- Mahotas - Haralic 特征
- 标记区域的权重
- Mahotas - Zernike 特征
- Mahotas - Zernike 矩
- Mahotas - 排序滤波器
- Mahotas - 2D 拉普拉斯滤波器
- Mahotas - 多数滤波器
- Mahotas - 平均滤波器
- Mahotas - 中值滤波器
- Mahotas - Otsu 方法
- Mahotas - 高斯滤波
- Mahotas - 击中与不击中变换
- Mahotas - 标记最大数组
- Mahotas - 图像的平均值
- Mahotas - SURF 密集点
- Mahotas - SURF 积分
- Mahotas - Haar 变换
- 突出显示图像最大值
- 计算线性二值模式
- 获取标签的边界
- 反转 Haar 变换
- Riddler-Calvard 方法
- 标记区域的大小
- Mahotas - 模板匹配
- 加速鲁棒特征
- 去除边界标记
- Mahotas - Daubechies 小波
- Mahotas - Sobel 边缘检测
Mahotas - 加载图像为灰度
灰度图像是黑白图像或灰色单色的一种,仅由灰色阴影组成。对比度范围从黑色到白色,分别为最弱强度到最强强度。
灰度图像仅包含亮度信息,不包含颜色信息。这就是白色是最大亮度(亮度)而黑色是零亮度的原因,介于两者之间的一切都包含灰色阴影。
加载灰度图像
在 Mahotas 中,加载灰度图像涉及读取仅包含每个像素强度值的图像文件。生成的图像表示为一个二维数组,其中每个元素表示像素的强度。
以下是 Mahotas 中加载灰度图像的基本语法:
mahotas.imread('image.file_format', as_grey=True)
其中,'image.file_format' 是要加载的图像的实际路径和格式,'as_grey=True' 作为参数传递以指示我们要将图像加载为灰度。
示例
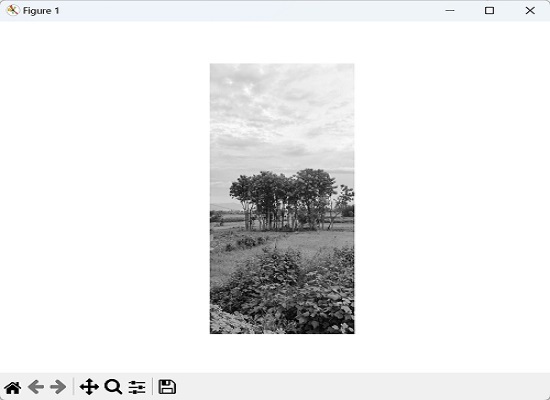
以下是 Mahotas 中加载灰度图像的示例:
import mahotas as ms
import matplotlib.pyplot as mtplt
# Loading grayscale image
grayscale_image = ms.imread('nature.jpeg', as_grey=True)
# Displaying grayscale image
mtplt.imshow(grayscale_image, cmap='gray')
mtplt.axis('off')
mtplt.show()
输出
执行上述代码后,我们得到如下所示的输出:
加载不同的图像格式为灰度
图像格式是指用于以数字方式存储和编码图像的不同文件格式。每种格式都有其自身的规范、特性和压缩方法。
Mahotas 提供了广泛的图像格式,包括 JPEG、PNG、BMP、TIFF 和 GIF 等常用格式。我们可以将任何这些格式的灰度图像的文件路径传递给 imread() 函数。
示例
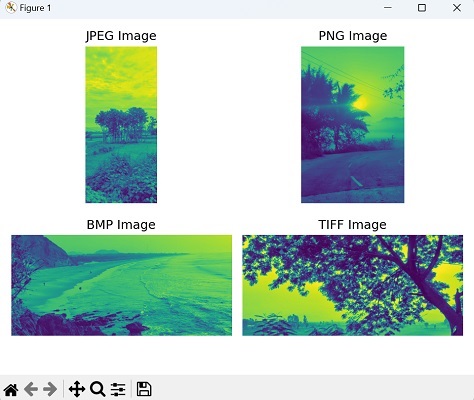
在此示例中,我们通过使用 imread() 函数加载不同格式的灰度图像来演示 Mahotas 的多功能性。每个加载的图像都存储在单独的变量中:
import mahotas as ms
import matplotlib.pyplot as mtplt
# Loading JPEG image
image_jpeg = ms.imread('nature.jpeg', as_grey = True)
# Loading PNG image
image_png = ms.imread('sun.png',as_grey = True)
# Loading BMP image
image_bmp = ms.imread('sea.bmp',as_grey = True)
# Loading TIFF image
image_tiff = ms.imread('tree.tiff',as_grey = True)
# Creating a figure and subplots
fig, axes = mtplt.subplots(2, 2)
# Displaying JPEG image
axes[0, 0].imshow(image_jpeg)
axes[0, 0].axis('off')
axes[0, 0].set_title('JPEG Image')
# Displaying PNG image
axes[0, 1].imshow(image_png)
axes[0, 1].axis('off')
axes[0, 1].set_title('PNG Image')
# Displaying BMP image
axes[1, 0].imshow(image_bmp)
axes[1, 0].axis('off')
axes[1, 0].set_title('BMP Image')
# Displaying TIFF image
axes[1, 1].imshow(image_tiff)
axes[1, 1].axis('off')
axes[1, 1].set_title('TIFF Image')
# Adjusting the spacing and layout
mtplt.tight_layout()
# Showing the figure
mtplt.show()
输出
显示的图像如下:
使用颜色模式“L”
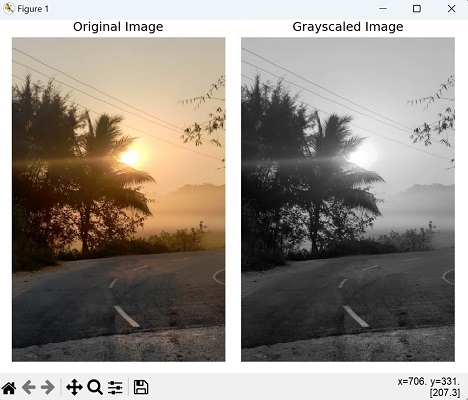
“L”颜色模式表示亮度,它是颜色亮度的度量。它源自 RGB(红、绿、蓝)颜色模型,其中红色、绿色和蓝色通道的强度值组合在一起以计算灰度强度。“L”模式丢弃颜色信息,并仅使用灰度强度值表示图像。
要在 mahotas 中通过将颜色模式指定为“L”来加载图像为灰度,我们需要将参数 as_grey='L' 传递给 imread() 函数。
示例
在这里,我们正在加载灰度图像并将颜色模式指定为“L”:
import mahotas as ms
import matplotlib.pyplot as mtplt
# Loading grayscale image
image = ms.imread('sun.png')
grayscale_image = ms.imread('sun.png', as_grey = 'L')
# Creating a figure and subplots
fig, axes = mtplt.subplots(1, 2)
# Displaying original image
axes[0].imshow(image)
axes[0].axis('off')
axes[0].set_title('Original Image')
# Displaying grayscale image
axes[1].imshow(grayscale_image, cmap='gray')
axes[1].axis('off')
axes[1].set_title('Grayscaled Image')
# Adjusting the spacing and layout
mtplt.tight_layout()
# Showing the figure
mtplt.show()
输出
以下是上述代码的输出:
广告