- Mahotas 教程
- Mahotas - 首页
- Mahotas - 简介
- Mahotas - 计算机视觉
- Mahotas - 历史
- Mahotas - 特性
- Mahotas - 安装
- Mahotas 图像处理
- Mahotas - 图像处理
- Mahotas - 加载图像
- Mahotas - 加载灰度图像
- Mahotas - 显示图像
- Mahotas - 显示图像形状
- Mahotas - 保存图像
- Mahotas - 图像质心
- Mahotas - 图像卷积
- Mahotas - 创建RGB图像
- Mahotas - 图像欧拉数
- Mahotas - 图像中零的比例
- Mahotas - 获取图像矩
- Mahotas - 图像局部最大值
- Mahotas - 图像椭圆轴
- Mahotas - 图像RGB拉伸
- Mahotas 颜色空间转换
- Mahotas - 颜色空间转换
- Mahotas - RGB转灰度转换
- Mahotas - RGB转LAB转换
- Mahotas - RGB转褐色
- Mahotas - RGB转XYZ转换
- Mahotas - XYZ转LAB转换
- Mahotas - XYZ转RGB转换
- Mahotas - 增加伽马校正
- Mahotas - 拉伸伽马校正
- Mahotas 标记图像函数
- Mahotas - 标记图像函数
- Mahotas - 标记图像
- Mahotas - 过滤区域
- Mahotas - 边界像素
- Mahotas - 形态学运算
- Mahotas - 形态学算子
- Mahotas - 查找图像均值
- Mahotas - 裁剪图像
- Mahotas - 图像偏心率
- Mahotas - 图像叠加
- Mahotas - 图像圆度
- Mahotas - 调整图像大小
- Mahotas - 图像直方图
- Mahotas - 图像膨胀
- Mahotas - 图像腐蚀
- Mahotas - 分水岭算法
- Mahotas - 图像开运算
- Mahotas - 图像闭运算
- Mahotas - 填充图像空洞
- Mahotas - 条件膨胀图像
- Mahotas - 条件腐蚀图像
- Mahotas - 图像条件分水岭算法
- Mahotas - 图像局部最小值
- Mahotas - 图像区域最大值
- Mahotas - 图像区域最小值
- Mahotas - 高级概念
- Mahotas - 图像阈值化
- Mahotas - 设置阈值
- Mahotas - 软阈值
- Mahotas - Bernsen 局部阈值化
- Mahotas - 小波变换
- 制作图像小波中心
- Mahotas - 距离变换
- Mahotas - 多边形工具
- Mahotas - 局部二值模式
- 阈值邻接统计
- Mahotas - Haralic 特征
- 标记区域的权重
- Mahotas - Zernike 特征
- Mahotas - Zernike 矩
- Mahotas - 排序滤波器
- Mahotas - 2D 拉普拉斯滤波器
- Mahotas - 多数滤波器
- Mahotas - 均值滤波器
- Mahotas - 中值滤波器
- Mahotas - Otsu 方法
- Mahotas - 高斯滤波
- Mahotas - Hit & Miss 变换
- Mahotas - 标记最大值数组
- Mahotas - 图像均值
- Mahotas - SURF 密集点
- Mahotas - SURF 积分图像
- Mahotas - Haar 变换
- 突出显示图像最大值
- 计算线性二值模式
- 获取标签边界
- 反转 Haar 变换
- Riddler-Calvard 方法
- 标记区域的大小
- Mahotas - 模板匹配
- 加速鲁棒特征
- 移除带边框的标记
- Mahotas - Daubechies 小波
- Mahotas - Sobel 边缘检测
Mahotas - Sobel 边缘检测
Sobel 边缘检测是一种用于识别图像中边缘的算法。边缘代表不同区域之间的边界。它的工作原理是计算每个像素的图像强度梯度。
简单来说,它测量像素值的改变以确定高变化区域,这些区域对应于图像中的边缘。
Mahotas 中的 Sobel 边缘检测
在 Mahotas 中,我们可以使用 **mahotas.sobel()** 函数来检测图像中的边缘。
Sobel 函数使用两个单独的滤波器,一个用于水平变化 (Gx),另一个用于垂直变化 (Gy)。
这些滤波器通过卷积与图像的像素值应用于图像。这计算了水平和垂直方向的梯度。
一旦获得两个方向的梯度,Sobel 函数就会将它们组合起来计算每个像素的整体梯度幅度。
这是使用勾股定理完成的,它计算水平和垂直梯度的平方和的平方根。
$$\mathrm{M\:=\:\sqrt{(Gx^{2}\:+\:Gy^{2})}}$$
图像的最终梯度幅度 (M) 表示原始图像中边缘的强度。较高的值表示较强的边缘,而较低的值对应于较平滑的区域。
mahotas.sobel() 函数
mahotas.sobel() 函数接收灰度图像作为输入,并返回二值图像作为输出,其中边缘使用 Sobel 边缘检测算法计算。
结果图像中的白色像素表示边缘,而黑色像素表示其他区域。
语法
以下是 Mahotas 中 sobel() 函数的基本语法:
mahotas.sobel(img, just_filter=False)
其中:
**img** - 输入灰度图像。
**just_filter (可选)** - 一个标志,用于指定是否对滤波后的图像进行阈值化(默认值为 false)。
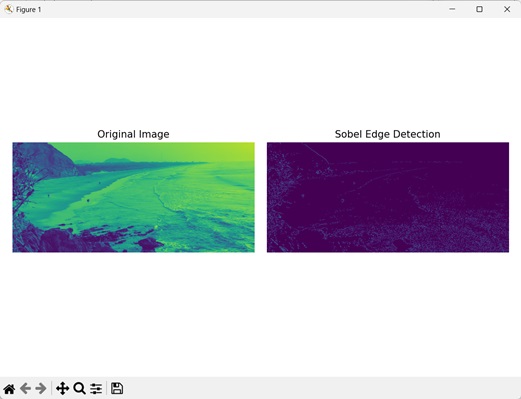
示例
在下面的示例中,我们使用 Sobel 边缘检测算法来使用 mh.sobel() 函数检测边缘。
import mahotas as mh
import numpy as np
import matplotlib.pyplot as mtplt
# Loading the image
image = mh.imread('sea.bmp')
# Converting it to grayscale
image = mh.colors.rgb2gray(image)
# Applying sobel gradient to detect edges
sobel = mh.sobel(image)
# Creating a figure and axes for subplots
fig, axes = mtplt.subplots(1, 2)
# Displaying the original image
axes[0].imshow(image)
axes[0].set_title('Original Image')
axes[0].set_axis_off()
# Displaying the edges
axes[1].imshow(sobel)
axes[1].set_title('Sobel Edge Detection')
axes[1].set_axis_off()
# Adjusting spacing between subplots
mtplt.tight_layout()
# Showing the figures
mtplt.show()
输出
以下是上述代码的输出:
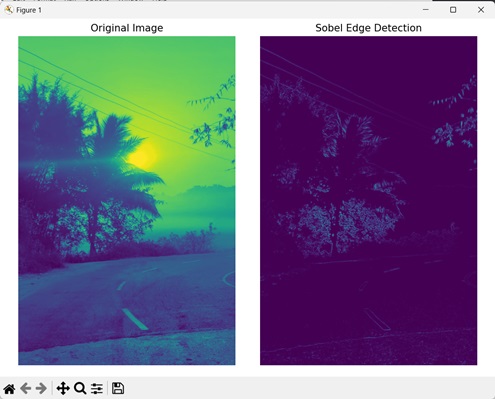
未进行阈值化的输出图像
我们还可以不进行阈值化输出图像来执行 Sobel 边缘检测算法。阈值化是指通过将像素分类为前景或背景来将图像转换为二值图像。
转换是通过将像素的强度值与阈值(固定)值进行比较来实现的。
在 Mahotas 中,sobel() 函数中的 **just_filter** 参数决定是否对输出图像进行阈值化。我们可以将此参数设置为“True”以防止对输出图像进行阈值化。
如果过滤器设置为“False”,则会对输出图像进行阈值化。
示例
在下面提到的示例中,我们在使用 Sobel 边缘检测算法时没有对输出图像进行阈值化。
import mahotas as mh
import numpy as np
import matplotlib.pyplot as mtplt
# Loading the image
image = mh.imread('sun.png')
# Converting it to grayscale
image = mh.colors.rgb2gray(image)
# Applying sobel gradient to detect edges
sobel = mh.sobel(image, just_filter=True)
# Creating a figure and axes for subplots
fig, axes = mtplt.subplots(1, 2)
# Displaying the original image
axes[0].imshow(image)
axes[0].set_title('Original Image')
axes[0].set_axis_off()
# Displaying the edges
axes[1].imshow(sobel)
axes[1].set_title('Sobel Edge Detection')
axes[1].set_axis_off()
# Adjusting spacing between subplots
mtplt.tight_layout()
# Showing the figures
mtplt.show()
输出
执行上述代码后,我们将得到以下输出:
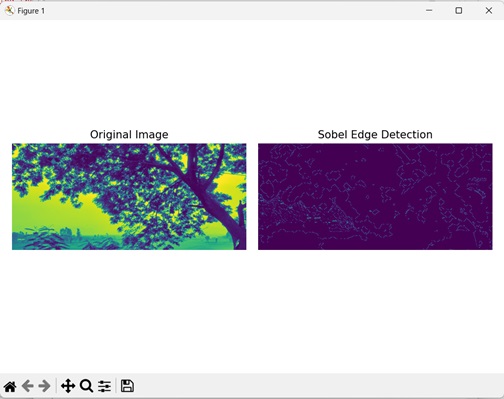
在阈值图像上
Sobel 边缘检测也可以在阈值图像上执行。阈值图像是一个二值图像,其中像素被分类为前景或背景。
前景像素为白色,用值 1 表示,而背景像素为黑色,用值 0 表示。
在 Mahotas 中,我们首先使用任何阈值化算法对输入图像进行阈值化。让我们假设Bernsen 阈值化算法。这可以通过在灰度图像上使用 mh.thresholding.bernsen() 函数来完成。
然后,我们应用 Sobel 边缘检测算法来检测阈值图像的边缘。
示例
在这里,我们正在使用 Sobel 边缘检测算法在阈值图像上检测图像的边缘。
import mahotas as mh
import numpy as np
import matplotlib.pyplot as mtplt
# Loading the image
image = mh.imread('tree.tiff')
# Converting it to grayscale
image = mh.colors.rgb2gray(image)
# Applying threshold on the image
threshold_image = mh.thresholding.bernsen(image, 17, 19)
# Applying sobel gradient to detect edges
sobel = mh.sobel(threshold_image)
# Creating a figure and axes for subplots
fig, axes = mtplt.subplots(1, 2)
# Displaying the original image
axes[0].imshow(image)
axes[0].set_title('Original Image')
axes[0].set_axis_off()
# Displaying the edges
axes[1].imshow(sobel)
axes[1].set_title('Sobel Edge Detection')
axes[1].set_axis_off()
# Adjusting spacing between subplots
mtplt.tight_layout()
# Showing the figures
mtplt.show()
输出
执行上述代码后,我们将得到以下输出: