- Unix Commands Reference
- Unix Commands - Home
dprofpp Command in Linux
The Linux dprofpp command displays the Perl profile data to analyze the performance of the Perl program. It gives useful insights into a Perl program, that can be used to optimize and enhance the code's performance. It helps identify the bottlenecks, generate profiles of a specific part of the code, and provide time-based profiling data.
Table of Contents
Here is a comprehensive guide to the options available with the dprofpp command −
- Prerequisites of using the dprofpp Command
- Syntax of dprofpp Command
- dprofpp Command Options
- Understanding the dprofpp Command Output
- Examples of dprofpp Command in Linux
Prerequisites of using the dprofpp Command
The dprofpp command is part of the libdevel-dprof-perl module, which provides the Devel::DProf package. This package collects information on the Perl code execution time to determine the time taken by different subroutines. This information can be used to create an execution graph of the code.
To install the dprofpp command on Ubuntu, Kali Linux, Debian, and Debian-based distributions, use −
sudo apt install libdevel-dprof-perl
To install it on Fedora, use the following command −
sudo dnf install libdevel-dprof-perl
To verify the installation of the dprofpp command, check its version −
dprofpp -V

Syntax of dprofpp Command
The general syntax of using the Linux dprofpp command is as follows −
dprofpp [options] [profile]
To change the output of the dprofpp command, various options can be specified in place of the [options] field in the syntax. While the [profile] field is used to specify the Perl script profile.
dprofpp Command Options
The options for the dprofpp command are listed below −
| Options | Description |
|---|---|
| -a | It sorts the routines alphabetically |
| -d | It reverses the sort |
| -R | It counts the anonymous subroutines defined in the same package |
| -E | It displays all the subroutine times exclusive of child subroutines (default) |
| -F | It generates the fake exit timestamps if the dprofpp command reports that the profile is garbled |
| -I | It displays all the subroutine times inclusive of child subroutines |
| -O cnt | It shows the specified number of subroutines (default: 15) |
| -p script | It profiles a specified Perl script |
| -Q | It is used with the -p option to tell dprofpp to quit after profiling the script |
| -q | It skips the column header |
| -r | It displays the elapsed real time instead of user+system times |
| -s | It displays the system time instead of user+system times |
| -T | It displays the subroutine call tree without statistics |
| -t | It displays the subroutine call tree without statistics (Multiple function callings displayed only once) |
| -S | It displays the subroutine call tree with statistics |
| -U | It prevents sorting |
| -u | It displays the user’s time instead of user+system times |
| -V | It displays the dprofpp command version |
| -v | It sorts by average time spent in subroutines during each call |
| -z | It sorts by user+system time used (default) |
| -g subroutine | To ignore the specified subroutine |
| -G regex | It aggregates or groups all calls matching the specified pattern |
| -P | It aggregates or groups all calls that do not match the pattern (used with -G) |
| -f regex | It filters all the calls matching the pattern |
| -h | It displays brief help about the dprofpp command |
| -H | It displays detailed help about the dprofpp command |
Understanding the dprofpp Command Output
The dprofpp command output contains seven columns. A typical output is shown in the following image −

The name and description of each column are listed below −
| Column | Description |
|---|---|
| %Time | It shows the percentage of time spent on this routine |
| ExclSec (seconds) | It represents the time spent in this routine, not including the routines called from it |
| Cumuls (seconds) | It shows the time spent in this routine, including the routines called from it |
| #Call | It shows the number of calls to this routine |
| sec/call | It displays the average number of seconds per call to this routine |
| Csec/c (seconds) | It shows the average time spent in each call of this routine including those called from it |
| Name | It shows the name of the routine |
Examples of dprofpp Command in Linux
This section discusses the usage of the dprofpp command on Linux through various examples −
- Generating a Profile and Displaying its Data
- Generating a Profile and Displaying its Data through dprofpp Command
- Displaying Profile Data in Different Formats
- Displaying Specific Number of Routines
- Sorting the Routines
- Displaying the Subroutines Call Tree
- Displaying Specific Subroutine and Its Calls
Generating a Profile and Displaying its Data
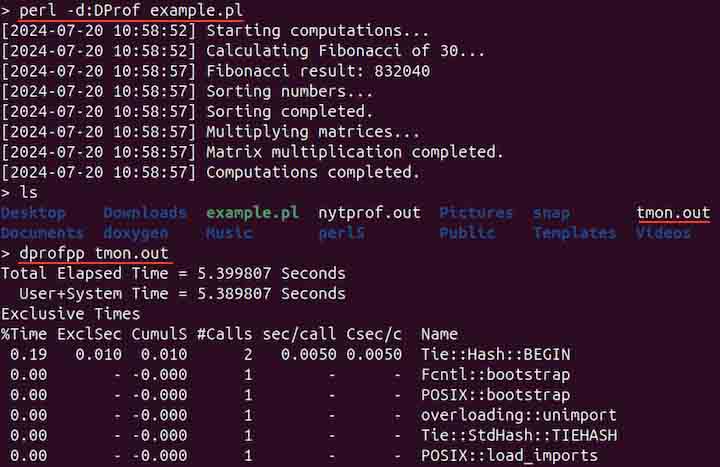
To use the dprofpp command, first, we need to generate a profile of a Perl script. It can be generated through two different modules, Devel::DProf or Devel::NYTProf. To create a profile of a script, example.pl, run the following command −
perl -d:DProf example.pl
Depending upon the complexity of the script, the above command may take time. After the successful execution, a file named tmon.out is generated in the current working directory. To display the profile data, use the dprofpp command −
dprofpp tmon.out

If the tmon.out file is generated in some other directory, its path can be specified −
dprofpp /path/tmon.out
Generating a Profile and Displaying its Data through dprofpp Command
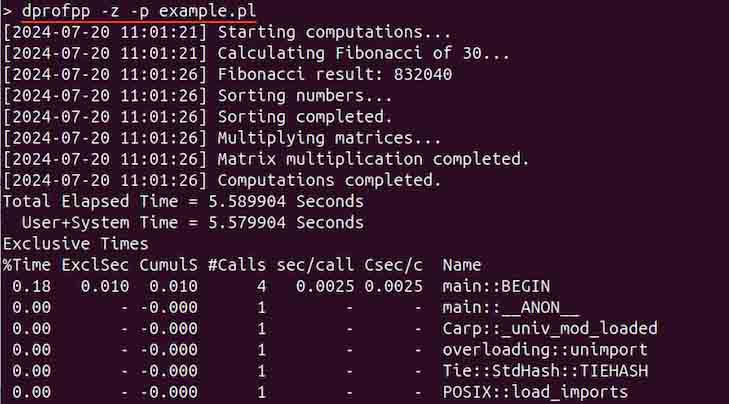
The profile can be generated and analyzed through the dprofpp command −
dprofpp -z -p example.pl

The -z option is used to sort by user+system times and the -p is used to specify the script name.
Displaying Profile Data in Different Formats
The profile data can be displayed in various formats. By default, the dprofpp command displays user+system time. The user time is the time the Perl script takes in the user space. While the system time is the time the Perl script takes in the kernel space.
To display the data in a real-time format, use the -r option −
dprofpp -r tmon.out
Similarly, to display only the system time, use the -s option.
dprofpp -s tmon.out

Other options can be seen in the above options sections.
Displaying Specific Number of Routines
By default, the output does not show all the routines; it only displays 15 routines. To display a specific number of routines, use the -O flag with the number of routines −
dprofpp -O 5 tmon.out

Sorting the Routines
By default, the routines are sorted by the user+system times used. To sort the routine alphabetically, use the -a flag −
dprofpp -a tmon.out
To display the data in an unsorted form, use the -U flag −
dprofpp -U tmon.out
Displaying the Subroutines Call Tree
To display the subroutine call tree to the standard output, use the -T flag −
dprofpp -T tmon.out
To display the subroutine calls with statistics, use the -S option −
dprofpp -S tmon.out

Displaying Specific Subroutine and Its Calls
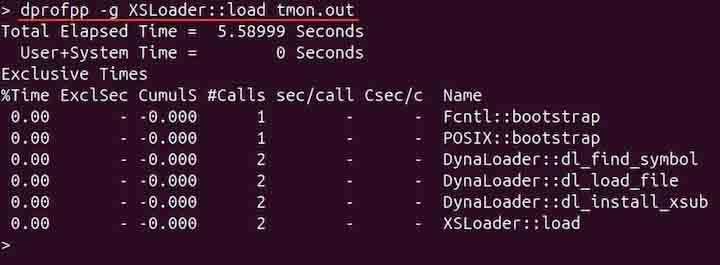
To display a specific subroutine and its calls, use the -g option with the subroutine name.
dprofpp -g XSLoader::load tmon.out

Conclusion
The dprofpp command in Linux is used to display the profile data of a Perl script. It is a powerful tool for analyzing the script performance. It displays the routines in various sorting formats. Moreover, it can filter the routine using regex.
This guide discussed the installation of the dprofpp command on Linux, its syntax, options, and usage through various examples.