- Matplotlib 基础
- Matplotlib - 首页
- Matplotlib - 简介
- Matplotlib - 与Seaborn对比
- Matplotlib - 环境配置
- Matplotlib - Anaconda发行版
- Matplotlib - Jupyter Notebook
- Matplotlib - Pyplot API
- Matplotlib - 简单绘图
- Matplotlib - 保存图形
- Matplotlib - 标记
- Matplotlib - 图形
- Matplotlib - 风格
- Matplotlib - 图例
- Matplotlib - 颜色
- Matplotlib - 颜色映射
- Matplotlib - 颜色映射归一化
- Matplotlib - 选择颜色映射
- Matplotlib - 颜色条
- Matplotlib - 文本
- Matplotlib - 文本属性
- Matplotlib - 子图标题
- Matplotlib - 图像
- Matplotlib - 图像遮罩
- Matplotlib - 注释
- Matplotlib - 箭头
- Matplotlib - 字体
- Matplotlib - 什么是字体?
- 全局设置字体属性
- Matplotlib - 字体索引
- Matplotlib - 字体属性
- Matplotlib - 比例尺
- Matplotlib - 线性和对数比例尺
- Matplotlib - 对称对数和Logit比例尺
- Matplotlib - LaTeX
- Matplotlib - 什么是LaTeX?
- Matplotlib - 用于数学表达式的LaTeX
- Matplotlib - 注释中的LaTeX文本格式
- Matplotlib - PostScript
- 启用注释中的LaTex渲染
- Matplotlib - 数学表达式
- Matplotlib - 动画
- Matplotlib - 图形元素
- Matplotlib - 使用Cycler进行样式设置
- Matplotlib - 路径
- Matplotlib - 路径效果
- Matplotlib - 变换
- Matplotlib - 刻度和刻度标签
- Matplotlib - 弧度刻度
- Matplotlib - 日期刻度
- Matplotlib - 刻度格式化器
- Matplotlib - 刻度定位器
- Matplotlib - 基本单位
- Matplotlib - 自动缩放
- Matplotlib - 反转坐标轴
- Matplotlib - 对数坐标轴
- Matplotlib - Symlog
- Matplotlib - 单位处理
- Matplotlib - 带单位的椭圆
- Matplotlib - 脊柱
- Matplotlib - 坐标轴范围
- Matplotlib - 坐标轴比例尺
- Matplotlib - 坐标轴刻度
- Matplotlib - 坐标轴格式化
- Matplotlib - Axes 类
- Matplotlib - 双坐标轴
- Matplotlib - Figure 类
- Matplotlib - 多图
- Matplotlib - 网格
- Matplotlib - 面向对象接口
- Matplotlib - PyLab 模块
- Matplotlib - subplots() 函数
- Matplotlib - subplot2grid() 函数
- Matplotlib - 定位图形元素
- Matplotlib - 手动等值线
- Matplotlib - 坐标报告
- Matplotlib - AGG 滤镜
- Matplotlib - 带状框
- Matplotlib - 填充螺旋线
- Matplotlib - findobj 演示
- Matplotlib - 超链接
- Matplotlib - 图像缩略图
- Matplotlib - 使用关键字绘图
- Matplotlib - 创建Logo
- Matplotlib - 多页PDF
- Matplotlib - 多进程
- Matplotlib - 打印标准输出
- Matplotlib - 复合路径
- Matplotlib - Sankey 类
- Matplotlib - MRI与EEG
- Matplotlib - 样式表
- Matplotlib - 背景颜色
- Matplotlib - Basemap
- Matplotlib 事件处理
- Matplotlib - 事件处理
- Matplotlib - 关闭事件
- Matplotlib - 鼠标移动
- Matplotlib - 点击事件
- Matplotlib - 滚动事件
- Matplotlib - 按键事件
- Matplotlib - 选择事件
- Matplotlib - 透视镜
- Matplotlib - 路径编辑器
- Matplotlib - 多边形编辑器
- Matplotlib - 定时器
- Matplotlib - viewlims
- Matplotlib - 缩放窗口
- Matplotlib 小部件
- Matplotlib - 光标小部件
- Matplotlib - 带注释的光标
- Matplotlib - 按钮小部件
- Matplotlib - 复选框
- Matplotlib - 套索选择器
- Matplotlib - 菜单小部件
- Matplotlib - 鼠标光标
- Matplotlib - 多光标
- Matplotlib - 多边形选择器
- Matplotlib - 单选按钮
- Matplotlib - RangeSlider
- Matplotlib - 矩形选择器
- Matplotlib - 椭圆选择器
- Matplotlib - 滑块小部件
- Matplotlib - 区间选择器
- Matplotlib - 文本框
- Matplotlib 绘图
- Matplotlib - 条形图
- Matplotlib - 直方图
- Matplotlib - 饼图
- Matplotlib - 散点图
- Matplotlib - 箱线图
- Matplotlib - 小提琴图
- Matplotlib - 等高线图
- Matplotlib - 3D绘图
- Matplotlib - 3D等高线
- Matplotlib - 3D线框图
- Matplotlib - 3D曲面图
- Matplotlib - 矢羽图
- Matplotlib 有用资源
- Matplotlib - 快速指南
- Matplotlib - 有用资源
- Matplotlib - 讨论
Matplotlib - 点击事件
一般来说,点击事件是指用户通过按下并释放鼠标按钮或点击触摸屏设备与计算机界面交互时发生的事件。此事件作为计算机系统识别和响应用户输入的触发器。
在数据可视化(例如Matplotlib或其他绘图库)的上下文中,点击事件可以用来捕捉用户与绘图的特定交互,提供动态和交互式的体验。这可能包括选择数据点、触发更新或启用用户启动的操作等任务。
Matplotlib中的点击事件
在Matplotlib中,当用户点击图形或其中的特定区域时,就会发生点击事件。这些事件与回调函数相关联,这些回调函数在点击发生时执行。这可以通过使用图形画布上的mpl_connect()方法将回调函数连接到button_press_event来实现。
让我们来看一个演示简单点击事件如何工作的基本示例。
示例
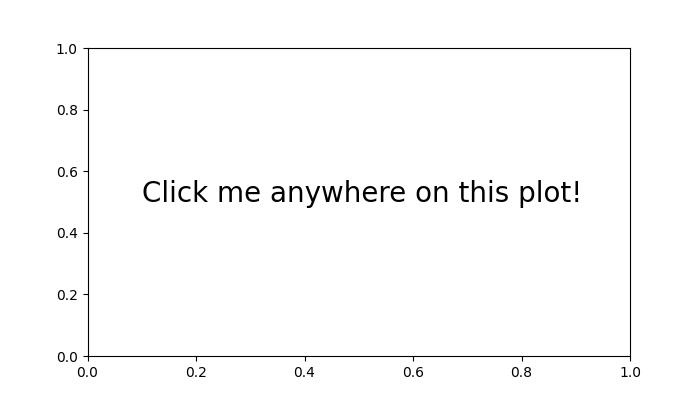
在这个示例中,点击事件由onclick函数处理,该函数在用户点击绘图上的任何位置时将消息打印到控制台。图形包含一个提示用户点击的文本元素。
import numpy as np
import matplotlib.pyplot as plt

def onclick(event):
   print('The Click Event Triggered!')

fig, ax = plt.subplots(figsize=(7, 4))
ax.text(0.1, 0.5, 'Click me anywhere on this plot!', dict(size=20))
cid = fig.canvas.mpl_connect('button_press_event', onclick)
plt.show()
输出
执行上述代码后,我们将得到以下输出:

The Click Event Triggered!
The Click Event Triggered!
The Click Event Triggered!
The Click Event Triggered!
The Click Event Triggered!
The Click Event Triggered!
观看下面的视频,观察点击事件功能在此处的工作方式。

存储点击事件坐标
存储点击事件坐标允许您收集有关用户在绘图上交互的信息,从而方便数据点选择或分析等任务。
示例
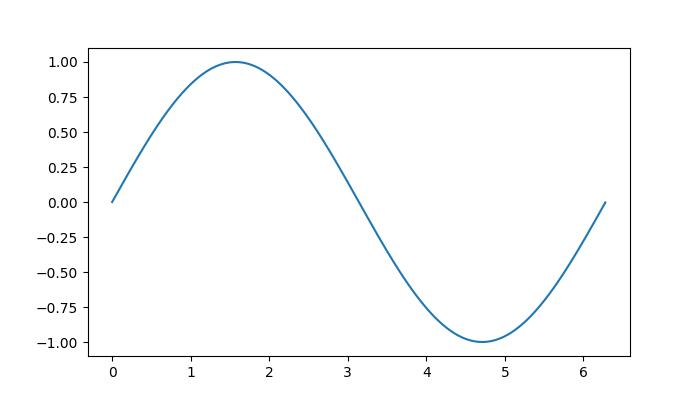
这是一个存储并打印绘图上鼠标点击坐标的示例。这演示了如何使用点击事件来收集有关用户在绘图上交互的信息。
import numpy as np
import matplotlib.pyplot as plt

x = np.arange(0, 2*np.pi, 0.01)
y = np.sin(x)

fig = plt.figure()
ax = fig.add_subplot(111)
ax.plot(x, y)

clicked_coords = []

def onclick(event):
   global ix, iy
   ix, iy = event.xdata, event.ydata
   print(f'Clicked at x = {ix}, y = {iy}')

   global clicked_coords
   clicked_coords.append((ix, iy))

   # Disconnect the click event after collecting 5 coordinates
   if len(clicked_coords) == 5:
      fig.canvas.mpl_disconnect(cid)
      print('Reached the maximum clicks...')

cid = fig.canvas.mpl_connect('button_press_event', onclick)
plt.show()
输出
执行上述代码后,我们将得到以下输出:

Clicked at x = 0.0743760368663593, y = 0.11428680137603275
Clicked at x = 1.4368755760368663, y = 0.9928568371128363
Clicked at x = 3.130449769585254, y = 0.10714395555703438
Clicked at x = 4.7221548387096774, y = -1.014282838025715
Clicked at x = 6.377528110599078, y = 0.04285834318604875
Reached the maximum clicks...
观看下面的视频,观察点击事件功能在此处的工作方式。

带有复选框的点击事件
将复选框小部件与点击事件集成,提供了一种动态的方式来控制用户在绘图上的交互。通过将复选框与点击事件相结合,您可以启用或禁用某些功能,从而为用户提供对绘图的交互式控制。
示例
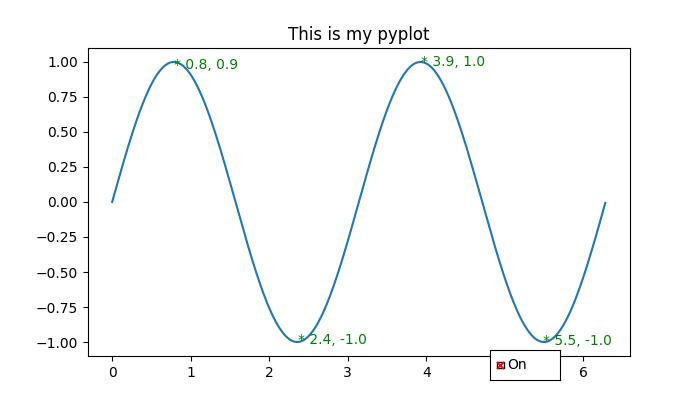
在这个示例中,使用复选框来控制在触发点击事件的绘图上添加文本。
import matplotlib.pyplot as plt
from matplotlib.widgets import CheckButtons
import numpy as np

def onclick(event):
   # Only use events within the axes.
   if not event.inaxes == ax1:
      return

   # Check if Checkbox is "on"
   if check_box.get_status()[0]:
      ix, iy = event.xdata, event.ydata
      coords3.append((ix, iy))

      # write text with coordinats where clicks occur
      if len(coords3) >= 1:
         ax1.annotate(f"* {ix:.1f}, {iy:.1f}", xy=(ix, iy), color="green")
         fig.canvas.draw_idle()

      # Disconnect after 6 clicks
      if len(coords3) >= 6:
         fig.canvas.mpl_disconnect(cid)
         print('Reached the maximum clicks...')
         plt.close(fig)

x = np.arange(0, 2*np.pi, 0.01)
y = np.sin(2*x)

fig, ax1 = plt.subplots(figsize=(7, 4))
ax1.plot(x, y)
ax1.set_title('This is my plot')

ax2 = plt.axes([0.7, 0.05, 0.1, 0.075])
check_box = CheckButtons(ax2, ['On',], [False,], check_props={'color':'red', 'linewidth':1})

coords3 = []
cid = fig.canvas.mpl_connect('button_press_event', onclick)
plt.show()
输出
执行上述代码后,我们将得到以下输出:

Reached the maximum clicks...
观看下面的视频,观察点击事件功能在此处的工作方式。

广告