- Matplotlib 基础
- Matplotlib - 首页
- Matplotlib - 简介
- Matplotlib - 与 Seaborn 的对比
- Matplotlib - 环境设置
- Matplotlib - Anaconda 发行版
- Matplotlib - Jupyter Notebook
- Matplotlib - Pyplot API
- Matplotlib - 简单绘图
- Matplotlib - 保存图形
- Matplotlib - 标记
- Matplotlib - 图形
- Matplotlib - 样式
- Matplotlib - 图例
- Matplotlib - 颜色
- Matplotlib - 色图
- Matplotlib - 色图归一化
- Matplotlib - 选择色图
- Matplotlib - 色条
- Matplotlib - 文本
- Matplotlib - 文本属性
- Matplotlib - 子图标题
- Matplotlib - 图像
- Matplotlib - 图像蒙版
- Matplotlib - 标注
- Matplotlib - 箭头
- Matplotlib - 字体
- Matplotlib - 什么是字体?
- 全局设置字体属性
- Matplotlib - 字体索引
- Matplotlib - 字体属性
- Matplotlib - 刻度
- Matplotlib - 线性和对数刻度
- Matplotlib - 对称对数和 Logit 刻度
- Matplotlib - LaTeX
- Matplotlib - 什么是 LaTeX?
- Matplotlib - LaTeX 用于数学表达式
- Matplotlib - LaTeX 在标注中的文本格式
- Matplotlib - PostScript
- 在标注中启用 LaTeX 渲染
- Matplotlib - 数学表达式
- Matplotlib - 动画
- Matplotlib - 艺术家
- Matplotlib - 使用 Cycler 进行样式设置
- Matplotlib - 路径
- Matplotlib - 路径效果
- Matplotlib - 变换
- Matplotlib - 刻度和刻度标签
- Matplotlib - 弧度刻度
- Matplotlib - 日期刻度
- Matplotlib - 刻度格式化程序
- Matplotlib - 刻度定位器
- Matplotlib - 基本单位
- Matplotlib - 自动缩放
- Matplotlib - 反转轴
- Matplotlib - 对数轴
- Matplotlib - Symlog
- Matplotlib - 单位处理
- Matplotlib - 带单位的椭圆
- Matplotlib - 脊柱
- Matplotlib - 轴范围
- Matplotlib - 轴刻度
- Matplotlib - 轴刻度
- Matplotlib - 格式化轴
- Matplotlib - Axes 类
- Matplotlib - 双轴
- Matplotlib - Figure 类
- Matplotlib - 多图
- Matplotlib - 网格
- Matplotlib - 面向对象接口
- Matplotlib - PyLab 模块
- Matplotlib - Subplots() 函数
- Matplotlib - Subplot2grid() 函数
- Matplotlib - 固定艺术家
- Matplotlib - 手动等值线
- Matplotlib - 坐标报告
- Matplotlib - AGG 过滤器
- Matplotlib - 带状框
- Matplotlib - 填充螺旋
- Matplotlib - Findobj 演示
- Matplotlib - 超链接
- Matplotlib - 图像缩略图
- Matplotlib - 使用关键字绘图
- Matplotlib - 创建徽标
- Matplotlib - 多页 PDF
- Matplotlib - 多进程
- Matplotlib - 打印标准输出
- Matplotlib - 复合路径
- Matplotlib - Sankey 类
- Matplotlib - 带 EEG 的 MRI
- Matplotlib - 样式表
- Matplotlib - 背景颜色
- Matplotlib - Basemap
- Matplotlib 事件处理
- Matplotlib - 事件处理
- Matplotlib - 关闭事件
- Matplotlib - 鼠标移动
- Matplotlib - 点击事件
- Matplotlib - 滚动事件
- Matplotlib - 按键事件
- Matplotlib - 选择事件
- Matplotlib - 观察镜
- Matplotlib - 路径编辑器
- Matplotlib - 多边形编辑器
- Matplotlib - 计时器
- Matplotlib - Viewlims
- Matplotlib - 缩放窗口
- Matplotlib 小部件
- Matplotlib - 光标小部件
- Matplotlib - 带注释的光标
- Matplotlib - 按钮小部件
- Matplotlib - 复选框
- Matplotlib - 套索选择器
- Matplotlib - 菜单小部件
- Matplotlib - 鼠标光标
- Matplotlib - 多光标
- Matplotlib - 多边形选择器
- Matplotlib - 单选按钮
- Matplotlib - RangeSlider
- Matplotlib - 矩形选择器
- Matplotlib - 椭圆选择器
- Matplotlib - 滑块小部件
- Matplotlib - 跨度选择器
- Matplotlib - 文本框
- Matplotlib 绘图
- Matplotlib - 条形图
- Matplotlib - 直方图
- Matplotlib - 饼图
- Matplotlib - 散点图
- Matplotlib - 箱线图
- Matplotlib - 小提琴图
- Matplotlib - 等值线图
- Matplotlib - 3D 绘图
- Matplotlib - 3D 等值线
- Matplotlib - 3D 线框图
- Matplotlib - 3D 表面图
- Matplotlib - Quiver 图
- Matplotlib 有用资源
- Matplotlib - 快速指南
- Matplotlib - 有用资源
- Matplotlib - 讨论
Matplotlib - 复合路径
在图形和设计中,“路径”是指由线或曲线连接的一系列点。它就像从一个点到另一个点画一条线。“复合”表示由多个部分或元素组成。
想象一下,您有几个基本形状,例如圆形、矩形和线条。单独来看,这些形状很简单,并且在它们可以表示的内容方面受到限制。但是,通过将它们以不同的排列和方向组合在一起,您可以创建更复杂和有趣的形状。这个将简单形状组合以创建更复杂形状的过程就是所谓的使用复合路径。

Matplotlib 中的复合路径
Matplotlib 中的复合路径是指多个简单路径或形状的组合,这些路径或形状组合在一起形成更复杂的形状。这些简单路径可以是线、曲线、多边形或其他基本形状。
在 Matplotlib 中,您可以使用“Path”类创建复合路径,该类允许您通过指定描述路径段的顶点和代码来定义自定义路径。然后,您可以使用这些自定义路径在绘图上绘制复杂的形状或图案。
复合路径:圆形和矩形的交集
Matplotlib 中圆形和矩形交集的复合路径是指创建一个表示圆形和矩形重叠或相交区域的单个形状。您不是将圆形和矩形视为单独的实体,而是将它们组合在一起以形成一个新的、更复杂的形状,该形状捕获它们相交的公共区域。
在 Matplotlib 中,您可以通过定义描述每个形状的路径段的顶点和代码来创建圆形和矩形交集的复合路径。然后,您将这些路径组合在一起以形成表示交集的复合路径。创建后,您可以使用此复合路径在绘图上绘制相交区域。
示例
在以下示例中,我们通过将它们的顶点和代码组合到单个 Path 对象中来创建一个表示圆形和矩形交集的复合路径 -
import matplotlib.pyplot as plt
from matplotlib.path import Path
from matplotlib.patches import PathPatch

# Defining the paths for the shapes
circle = Path.unit_circle()
rect = Path([(0.5, 0.5), (0.5, 1.5), (1.5, 1.5), (1.5, 0.5), (0.5, 0.5)], closed=True)

# Combining the paths into a compound path (Intersection)
compound_vertices = circle.vertices.tolist() + rect.vertices.tolist()
compound_codes = circle.codes.tolist() + rect.codes.tolist()
compound_path = Path(compound_vertices, compound_codes)

# Plotting the compound path
fig, ax = plt.subplots()
patch = PathPatch(compound_path, facecolor='blue', edgecolor='black')
ax.add_patch(patch)

# Setting plot limits and aspect ratio
ax.set_xlim(0, 2)
ax.set_ylim(0, 2)
ax.set_aspect('equal')

# Showing the plot
plt.title('Intersection of Circle and Rectangle')
plt.show()
输出
以下是上述代码的输出 -

两个矩形并集的复合路径
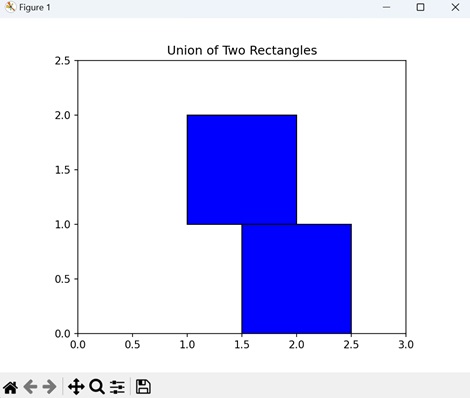
Matplotlib 中两个矩形并集的复合路径是指通过组合两个独立矩形覆盖的区域来创建一个单个形状。您不是将矩形视为单个形状,而是将它们合并在一起以形成一个新的、更复杂的形状。
在 Matplotlib 中,您可以通过定义描述每个矩形的路径段的顶点和代码来创建两个矩形并集的复合路径。然后,您将这些路径组合在一起以形成表示矩形并集的复合路径。创建后,您可以使用此复合路径在绘图上绘制组合形状。
示例
在这里,我们通过将它们的顶点和代码组合到单个 Path 对象中来创建一个表示两个矩形并集的复合路径 -
import matplotlib.pyplot as plt
from matplotlib.path import Path
from matplotlib.patches import PathPatch

# Defining the paths for the shapes
# Rectangle 1
path1 = Path([(1, 1), (1, 2), (2, 2), (2, 1), (1, 1)], closed=True)
# Rectangle 2
path2 = Path([(1.5, 0), (1.5, 1), (2.5, 1), (2.5, 0), (1.5, 0)], closed=True)

# Combining the paths into a compound path (Union)
compound_vertices = path1.vertices.tolist() + path2.vertices.tolist()
compound_codes = path1.codes.tolist() + path2.codes.tolist()
compound_path = Path(compound_vertices, compound_codes)

# Plotting the compound path
fig, ax = plt.subplots()
patch = PathPatch(compound_path, facecolor='blue', edgecolor='black')
ax.add_patch(patch)

# Setting plot limits and aspect ratio
ax.set_xlim(0, 3)
ax.set_ylim(0, 2.5)
ax.set_aspect('equal')

# Displaying the plot
plt.title('Union of Two Rectangles')
plt.show()
输出
执行上述代码后,我们将获得以下输出 -
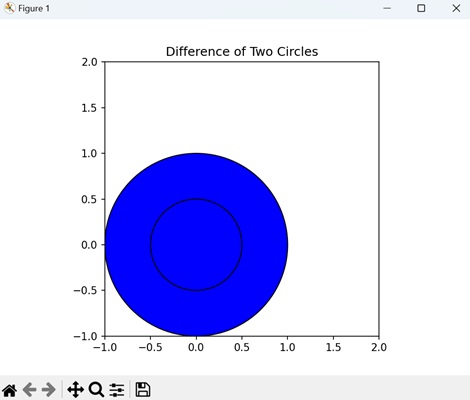
复合路径:两个圆形的差集
Matplotlib 中两个圆形差集的复合路径是指创建一个表示从另一个圆形中减去一个圆形后剩余区域的单个形状。
在 Matplotlib 中,您可以通过定义描述每个圆形的路径段的顶点和代码来创建两个圆形差集的复合路径。然后,您将这些路径组合在一起,并将较小圆形的路径从较大圆形的路径中减去,以形成表示差集的复合路径。创建后,您可以使用此复合路径在绘图上绘制剩余的环形区域。
示例
现在,我们通过将它们的顶点和代码组合到单个 Path 对象中来创建一个表示两个圆形之间差异的复合路径 -
import matplotlib.pyplot as plt
from matplotlib.path import Path
from matplotlib.patches import PathPatch
import numpy as np

# Defining the paths for the shapes
circle1 = Path.unit_circle()
circle2 = Path.unit_circle().transformed(plt.matplotlib.transforms.Affine2D().scale(0.5))

# Combining the paths into a compound path (Difference)
compound_vertices = np.concatenate([circle1.vertices, circle2.vertices])
compound_codes = np.concatenate([circle1.codes, circle2.codes])
compound_path = Path(compound_vertices, compound_codes)

# Plotting the compound path
fig, ax = plt.subplots()
patch = PathPatch(compound_path, facecolor='blue', edgecolor='black')
ax.add_patch(patch)

# Setting plot limits and aspect ratio
ax.set_xlim(-1, 2)
ax.set_ylim(-1, 2)
ax.set_aspect('equal')

# Displaying the plot
plt.title('Difference of Two Circles')
plt.show()
输出
执行上述代码后,我们将获得以下输出 -
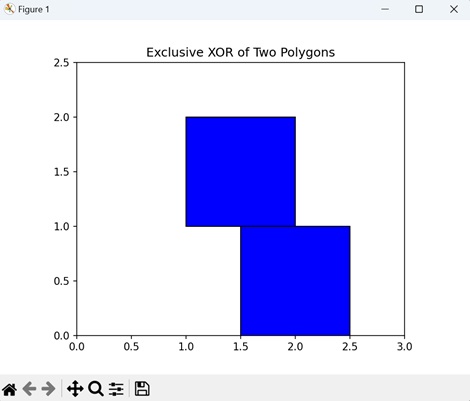
复合路径:两个多边形的异或
Matplotlib 中两个多边形的异或(异或)的复合路径表示两个多边形的组合,其中仅保留不重叠的区域。换句话说,它显示了专属于其中一个多边形但不属于两个多边形的区域。
在 Matplotlib 中,您可以通过定义描述每个多边形的路径段的顶点和代码来创建两个多边形异或的复合路径。然后,您将这些路径组合在一起并应用异或运算以确定专属于一个多边形或另一个多边形的区域。生成的复合路径表示这些不重叠的区域,您可以使用它们在绘图上进行绘制。
示例
在此示例中,我们通过将它们的顶点和代码组合到单个 Path 对象中来创建一个表示对两个多边形执行异或运算的复合路径 -
import matplotlib.pyplot as plt
from matplotlib.path import Path
from matplotlib.patches import PathPatch

# Defining the paths for the shapes
poly1 = Path([(1, 1), (1, 2), (2, 2), (2, 1), (1, 1)], closed=True)  # Rectangle
poly2 = Path([(1.5, 0), (1.5, 1), (2.5, 1), (2.5, 0), (1.5, 0)], closed=True)  # Triangle

# Combining the paths into a compound path (Exclusive XOR)
compound_vertices = poly1.vertices.tolist() + poly2.vertices.tolist()
compound_codes = poly1.codes.tolist() + poly2.codes.tolist()
compound_path = Path(compound_vertices, compound_codes)

# Plotting the compound path
fig, ax = plt.subplots()
patch = PathPatch(compound_path, facecolor='blue', edgecolor='black')
ax.add_patch(patch)

# Setting plot limits and aspect ratio
ax.set_xlim(0, 3)
ax.set_ylim(0, 2.5)
ax.set_aspect('equal')

# Displaying the plot
plt.title('Exclusive XOR of Two Polygons')
plt.show()
输出
执行上述代码后,我们将获得以下输出 -