- Matplotlib 基础
- Matplotlib - 首页
- Matplotlib - 简介
- Matplotlib - 与 Seaborn 的比较
- Matplotlib - 环境设置
- Matplotlib - Anaconda 发行版
- Matplotlib - Jupyter Notebook
- Matplotlib - Pyplot API
- Matplotlib - 简单绘图
- Matplotlib - 保存图形
- Matplotlib - 标记
- Matplotlib - 图形
- Matplotlib - 样式
- Matplotlib - 图例
- Matplotlib - 颜色
- Matplotlib - 颜色图
- Matplotlib - 颜色图归一化
- Matplotlib - 选择颜色图
- Matplotlib - 色标
- Matplotlib - 文本
- Matplotlib - 文本属性
- Matplotlib - 子图标题
- Matplotlib - 图像
- Matplotlib - 图像蒙版
- Matplotlib - 注释
- Matplotlib - 箭头
- Matplotlib - 字体
- Matplotlib - 什么是字体?
- 全局设置字体属性
- Matplotlib - 字体索引
- Matplotlib - 字体属性
- Matplotlib - 刻度
- Matplotlib - 线性和对数刻度
- Matplotlib - 对称对数和 Logit 刻度
- Matplotlib - LaTeX
- Matplotlib - 什么是 LaTeX?
- Matplotlib - LaTeX 用于数学表达式
- Matplotlib - LaTeX 在注释中的文本格式化
- Matplotlib - PostScript
- 在注释中启用 LaTeX 渲染
- Matplotlib - 数学表达式
- Matplotlib - 动画
- Matplotlib - 艺术家
- Matplotlib - 使用 Cycler 进行样式设置
- Matplotlib - 路径
- Matplotlib - 路径效果
- Matplotlib - 转换
- Matplotlib - 刻度和刻度标签
- Matplotlib - 弧度刻度
- Matplotlib - 日期刻度
- Matplotlib - 刻度格式化器
- Matplotlib - 刻度定位器
- Matplotlib - 基本单位
- Matplotlib - 自动缩放
- Matplotlib - 反转轴
- Matplotlib - 对数轴
- Matplotlib - Symlog
- Matplotlib - 单位处理
- Matplotlib - 带单位的椭圆
- Matplotlib - 脊柱
- Matplotlib - 轴范围
- Matplotlib - 轴刻度
- Matplotlib - 轴刻度
- Matplotlib - 格式化轴
- Matplotlib - Axes 类
- Matplotlib - 双轴
- Matplotlib - Figure 类
- Matplotlib - 多图
- Matplotlib - 网格
- Matplotlib - 面向对象接口
- Matplotlib - PyLab 模块
- Matplotlib - Subplots() 函数
- Matplotlib - Subplot2grid() 函数
- Matplotlib - 锚定艺术家
- Matplotlib - 手动等值线
- Matplotlib - 坐标报告
- Matplotlib - AGG 过滤器
- Matplotlib - 带状框
- Matplotlib - 填充螺旋
- Matplotlib - Findobj 演示
- Matplotlib - 超链接
- Matplotlib - 图像缩略图
- Matplotlib - 使用关键字绘图
- Matplotlib - 创建徽标
- Matplotlib - 多页 PDF
- Matplotlib - 多处理
- Matplotlib - 打印标准输出
- Matplotlib - 复合路径
- Matplotlib - Sankey 类
- Matplotlib - MRI 与 EEG
- Matplotlib - 样式表
- Matplotlib - 背景颜色
- Matplotlib - Basemap
- Matplotlib 事件处理
- Matplotlib - 事件处理
- Matplotlib - 关闭事件
- Matplotlib - 鼠标移动
- Matplotlib - 点击事件
- Matplotlib - 滚动事件
- Matplotlib - 按键事件
- Matplotlib - 选择事件
- Matplotlib - 观察镜
- Matplotlib - 路径编辑器
- Matplotlib - 多边形编辑器
- Matplotlib - 计时器
- Matplotlib - Viewlims
- Matplotlib - 缩放窗口
- Matplotlib 小部件
- Matplotlib - 游标小部件
- Matplotlib - 带注释的游标
- Matplotlib - 按钮小部件
- Matplotlib - 复选框
- Matplotlib - 套索选择器
- Matplotlib - 菜单小部件
- Matplotlib - 鼠标游标
- Matplotlib - 多游标
- Matplotlib - 多边形选择器
- Matplotlib - 单选按钮
- Matplotlib - 范围滑块
- Matplotlib - 矩形选择器
- Matplotlib - 椭圆选择器
- Matplotlib - 滑块小部件
- Matplotlib - 跨度选择器
- Matplotlib - 文本框
- Matplotlib 绘图
- Matplotlib - 条形图
- Matplotlib - 直方图
- Matplotlib - 饼图
- Matplotlib - 散点图
- Matplotlib - 箱线图
- Matplotlib - 小提琴图
- Matplotlib - 等值线图
- Matplotlib - 3D 绘图
- Matplotlib - 3D 等值线
- Matplotlib - 3D 线框图
- Matplotlib - 3D 表面图
- Matplotlib - Quiver 图
- Matplotlib 有用资源
- Matplotlib - 快速指南
- Matplotlib - 有用资源
- Matplotlib - 讨论
Matplotlib - 日期刻度
在一般的绘图中,日期刻度指的是带有日期或时间信息的绘图的轴上的刻度线或标记的标签,替换默认的数值。此功能在处理时间序列数据时特别有用。
下图说明了绘图上的日期刻度 -

Matplotlib 中的日期刻度
Matplotlib 提供了强大的工具来绘制时间序列数据,允许用户在刻度线或标记上表示日期或时间,而不是默认的数值(日期刻度)。该库通过将日期实例转换为自默认纪元(1970-01-01T00:00:00)以来的天数来简化处理日期的过程。这种转换以及刻度定位和格式化都在后台进行,对用户来说是透明的。
matplotlib.dates 模块在处理各种日期相关功能方面发挥着关键作用。这包括将数据转换为日期时间对象、格式化日期刻度标签以及设置刻度的频率。
使用默认格式化器的基本日期刻度
Matplotlib 使用 AutoDateLocator 和 AutoDateFormatter 类分别设置轴的默认刻度定位器和格式化器。
示例
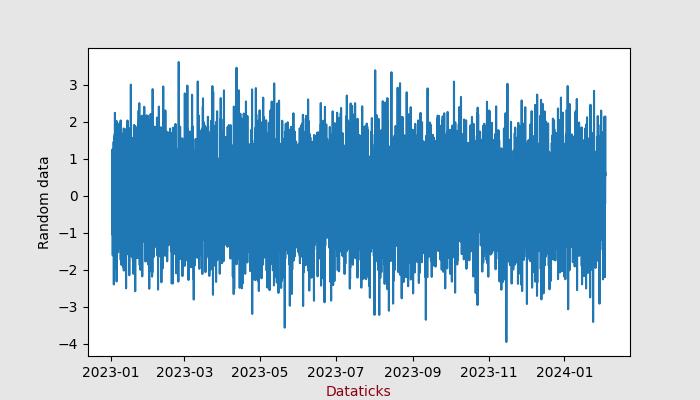
此示例演示了时间序列数据的绘图,此处 Matplotlib 自动处理日期格式。
import numpy as np
import matplotlib.pylab as plt

# Generate an array of dates
times = np.arange(np.datetime64('2023-01-02'),
   np.datetime64('2024-02-03'), np.timedelta64(75, 'm'))
# Generate random data for y axis
y = np.random.randn(len(times))

# Create subplots
fig, ax = plt.subplots(figsize=(7,4), facecolor='.9')
ax.plot(times, y)
ax.set_xlabel('Dataticks',color='xkcd:crimson')
ax.set_ylabel('Random data',color='xkcd:black')
plt.show()
输出
执行上述代码后,我们将获得以下输出 -

使用 DateFormatter 自定义日期刻度
对于日期格式的手动自定义,Matplotlib 提供了 DateFormatter 模块,允许用户更改日期刻度的格式。
示例
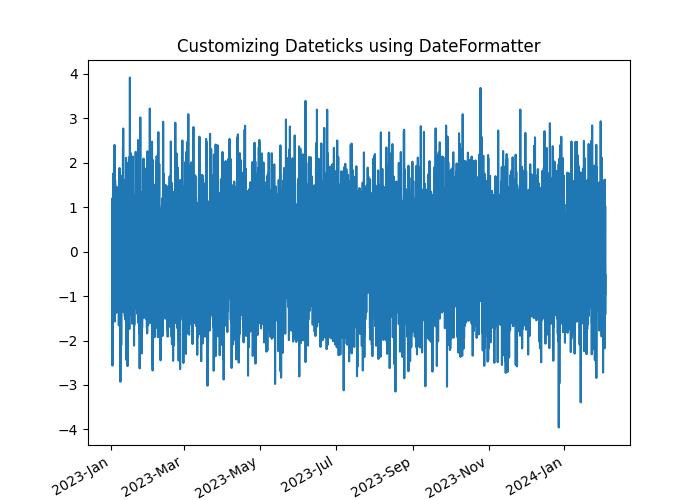
此示例演示了如何手动自定义日期刻度的格式。
import numpy as np
import matplotlib.pylab as plt
import matplotlib.dates as mdates

# Generate an array of dates
times = np.arange(np.datetime64('2023-01-02'),
   np.datetime64('2024-02-03'), np.timedelta64(75, 'm'))

# Generate random data for y axis
y = np.random.randn(len(times))

# Create subplots
fig, ax = plt.subplots(figsize=(7,5))
ax.plot(times, y)
ax.set_title('Customizing Dateticks using DateFormatter')

ax.xaxis.set_major_formatter(mdates.DateFormatter('%Y-%b'))
# Rotates and right-aligns the x labels so they don't overlap each other.
for label in ax.get_xticklabels(which='major'):
   label.set(rotation=30, horizontalalignment='right')

plt.show()
输出
执行上述代码后,我们将获得以下输出 -

使用 ConciseDateFormatter 进行高级格式化
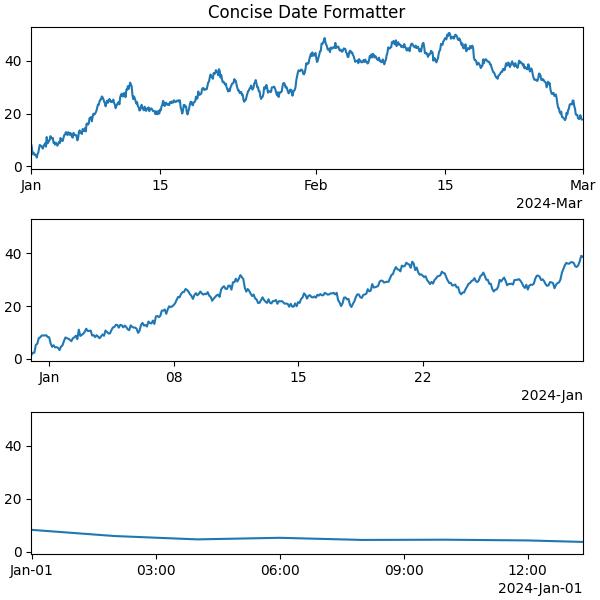
Matplotlib 中的 ConciseDateFormatter 类简化并增强了日期刻度的外观。此格式化器旨在优化刻度标签字符串的选择并最大程度地减少其长度,这通常消除了旋转标签的需要。
示例
此示例使用 ConciseDateFormatter 和 AutoDateLocator 类来设置绘图的最佳刻度限制和日期格式。
import datetime
import matplotlib.pyplot as plt
import matplotlib.dates as mdates
import numpy as np

# Define a starting date
base_date = datetime.datetime(2023, 12, 31)

# Generate an array of dates with a time delta of 2 hours
num_hours = 732
dates = np.array([base_date + datetime.timedelta(hours=(2 * i)) for i in range(num_hours)])
date_length = len(dates)

# Generate random data for the y-axis
np.random.seed(1967801)
y_axis = np.cumsum(np.random.randn(date_length))

# Define different date ranges
date_ranges = [
   (np.datetime64('2024-01'), np.datetime64('2024-03')),
   (np.datetime64('2023-12-31'), np.datetime64('2024-01-31')),
   (np.datetime64('2023-12-31 23:59'), np.datetime64('2024-01-01 13:20'))
]

# Create subplots for each date range
figure, axes = plt.subplots(3, 1, constrained_layout=True, figsize=(6, 6))

for nn, ax in enumerate(axes):
   # AutoDateLocator and ConciseDateFormatter for date formatting
   locator = mdates.AutoDateLocator(minticks=3, maxticks=7)
   formatter = mdates.ConciseDateFormatter(locator)

   ax.xaxis.set_major_locator(locator)
   ax.xaxis.set_major_formatter(formatter)

   # Plot the random data within the specified date range
   ax.plot(dates, y_axis)
   ax.set_xlim(date_ranges[nn])

axes[0].set_title('Concise Date Formatter')

# Show the plot
plt.show()
输出
执行上述代码后,我们将获得以下输出 -

广告