- Matplotlib 基础
- Matplotlib - 首页
- Matplotlib - 简介
- Matplotlib - Vs Seaborn
- Matplotlib - 环境设置
- Matplotlib - Anaconda 发行版
- Matplotlib - Jupyter Notebook
- Matplotlib - Pyplot API
- Matplotlib - 简单绘图
- Matplotlib - 保存图形
- Matplotlib - 标记
- Matplotlib - 图形
- Matplotlib - 样式
- Matplotlib - 图例
- Matplotlib - 颜色
- Matplotlib - 色图
- Matplotlib - 色图归一化
- Matplotlib - 选择色图
- Matplotlib - 色标
- Matplotlib - 文本
- Matplotlib - 文本属性
- Matplotlib - 子图标题
- Matplotlib - 图像
- Matplotlib - 图像掩码
- Matplotlib - 注释
- Matplotlib - 箭头
- Matplotlib - 字体
- Matplotlib - 什么是字体?
- 全局设置字体属性
- Matplotlib - 字体索引
- Matplotlib - 字体属性
- Matplotlib - 刻度
- Matplotlib - 线性和对数刻度
- Matplotlib - 对称对数和 Logit 刻度
- Matplotlib - LaTeX
- Matplotlib - 什么是 LaTeX?
- Matplotlib - LaTeX 用于数学表达式
- Matplotlib - LaTeX 在注释中的文本格式
- Matplotlib - PostScript
- 在注释中启用 LaTeX 渲染
- Matplotlib - 数学表达式
- Matplotlib - 动画
- Matplotlib - 图形对象
- Matplotlib - 使用 Cycler 样式化
- Matplotlib - 路径
- Matplotlib - 路径效果
- Matplotlib - 变换
- Matplotlib - 刻度和刻度标签
- Matplotlib - 弧度刻度
- Matplotlib - 日期刻度
- Matplotlib - 刻度格式化程序
- Matplotlib - 刻度定位器
- Matplotlib - 基本单位
- Matplotlib - 自动缩放
- Matplotlib - 反转轴
- Matplotlib - 对数轴
- Matplotlib - Symlog
- Matplotlib - 单位处理
- Matplotlib - 带单位的椭圆
- Matplotlib - 脊柱
- Matplotlib - 轴范围
- Matplotlib - 轴刻度
- Matplotlib - 轴刻度
- Matplotlib - 格式化轴
- Matplotlib - Axes 类
- Matplotlib - 双轴
- Matplotlib - Figure 类
- Matplotlib - 多图
- Matplotlib - 网格
- Matplotlib - 面向对象接口
- Matplotlib - PyLab 模块
- Matplotlib - Subplots() 函数
- Matplotlib - Subplot2grid() 函数
- Matplotlib - 固定图形对象
- Matplotlib - 手动等值线
- Matplotlib - 坐标报告
- Matplotlib - AGG 过滤器
- Matplotlib - 飘带框
- Matplotlib - 填充螺旋
- Matplotlib - Findobj 演示
- Matplotlib - 超链接
- Matplotlib - 图像缩略图
- Matplotlib - 使用关键字绘图
- Matplotlib - 创建 Logo
- Matplotlib - 多页 PDF
- Matplotlib - 多进程
- Matplotlib - 打印标准输出
- Matplotlib - 复合路径
- Matplotlib - Sankey 类
- Matplotlib - MRI 与 EEG
- Matplotlib - 样式表
- Matplotlib - 背景颜色
- Matplotlib - Basemap
- Matplotlib 事件处理
- Matplotlib - 事件处理
- Matplotlib - 关闭事件
- Matplotlib - 鼠标移动
- Matplotlib - 点击事件
- Matplotlib - 滚动事件
- Matplotlib - 按键事件
- Matplotlib - 选择事件
- Matplotlib - 放大镜
- Matplotlib - 路径编辑器
- Matplotlib - 多边形编辑器
- Matplotlib - 定时器
- Matplotlib - Viewlims
- Matplotlib - 缩放窗口
- Matplotlib 小部件
- Matplotlib - 光标小部件
- Matplotlib - 带注释的光标
- Matplotlib - 按钮小部件
- Matplotlib - 复选框
- Matplotlib - 套索选择器
- Matplotlib - 菜单小部件
- Matplotlib - 鼠标光标
- Matplotlib - 多光标
- Matplotlib - 多边形选择器
- Matplotlib - 单选按钮
- Matplotlib - 范围滑块
- Matplotlib - 矩形选择器
- Matplotlib - 椭圆选择器
- Matplotlib - 滑块小部件
- Matplotlib - 跨度选择器
- Matplotlib - 文本框
- Matplotlib 绘图
- Matplotlib - 条形图
- Matplotlib - 直方图
- Matplotlib - 饼图
- Matplotlib - 散点图
- Matplotlib - 箱线图
- Matplotlib - 小提琴图
- Matplotlib - 等值线图
- Matplotlib - 3D 绘图
- Matplotlib - 3D 等值线
- Matplotlib - 3D 线框图
- Matplotlib - 3D 曲面图
- Matplotlib - Quiver 图
- Matplotlib 有用资源
- Matplotlib - 快速指南
- Matplotlib - 有用资源
- Matplotlib - 讨论
Matplotlib - 滚动事件
通常,滚动事件发生在用户与鼠标滚轮交互时。鼠标中间的滚轮用于在任何页面上上下滚动,而无需使用文档或网页右侧的垂直滚动条。在本教程中,我们将探讨 Matplotlib 中的滚动事件处理。
Matplotlib 中的滚动事件
Matplotlib 提供了一种通过MouseEvent类处理滚动事件的机制。当用户滚动鼠标滚轮时,会触发此scroll_event事件。它用于为绘图中的交互式导航或缩放提供机制。
示例
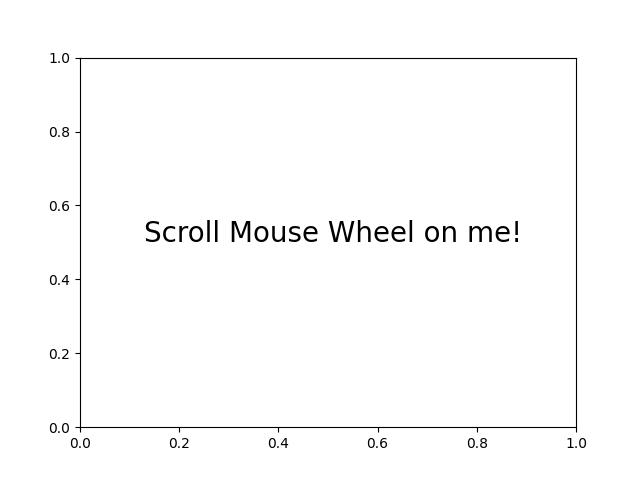
这是一个简单的示例,它检测滚动事件并根据用户向上或向下滚动鼠标滚轮显示消息。import matplotlib.pyplot as plt
import numpy as np
def on_scroll(event):
if event.button == 'up':
print('Scroll Up Event Triggered..')
elif event.button == 'down':
print('Scroll Down Event Triggered..')
# Create a figure and axis
fig, ax = plt.subplots()
ax.text(0.13, 0.5, 'Scroll Mouse Wheel on me!', dict(size=20))
# Connect the on_scroll method to the scroll_event
fig.canvas.mpl_connect('scroll_event', on_scroll)
plt.show()
输出
执行上述代码后,我们将得到以下输出 -

Scroll Up Event Triggered..
Scroll Up Event Triggered..
Scroll Down Event Triggered..
Scroll Up Event Triggered..
Scroll Down Event Triggered..
Scroll Up Event Triggered..
Scroll Up Event Triggered..
观看下面的视频,观察此滚动事件功能在此处的运行方式。

使用滚动事件缩放
Matplotlib 中的滚动事件可用于动态缩放绘图。通过将滚动事件连接到可调用函数,用户可以动态调整绘图内的视图。
示例
让我们看看一个演示如何使用滚动事件实现缩放功能的示例。
import matplotlib.pyplot as plt

def zoom_factory(axs, base_scale=2.):
   def zoom_fun(event):
      # get the current x and y limits
      cur_xlim = axs.get_xlim()
      cur_ylim = axs.get_ylim()
      cur_xrange = (cur_xlim[1] - cur_xlim[0]) * 0.2
      cur_yrange = (cur_ylim[1] - cur_ylim[0]) * 0.2

      # get event x location
      xdata = event.xdata
      ydata = event.ydata

      if event.button == 'up':
         # deal with zoom in
         scale_factor = 1/base_scale
      elif event.button == 'down':
         # deal with zoom out
         scale_factor = base_scale
      else:
         # deal with something that should never happen
         scale_factor = 1
         print(event.button)

      # set new limits
      axs.set_xlim([xdata - cur_xrange*scale_factor,
         xdata + cur_xrange*scale_factor])
      axs.set_ylim([ydata - cur_yrange*scale_factor,
         ydata + cur_yrange*scale_factor])

      # force re-draw
      plt.draw()

   # get the figure of interest
   fig = axs.get_figure()

   # Connect the call back function to the scroll_event
   fig.canvas.mpl_connect('scroll_event', zoom_fun)

   # return the function
   return zoom_fun

# Example Usage
fig, axs = plt.subplots(figsize=(7, 4))
axs.plot(range(100))
scale = 1.5
f = zoom_factory(axs, base_scale=scale)
plt.show()
输出
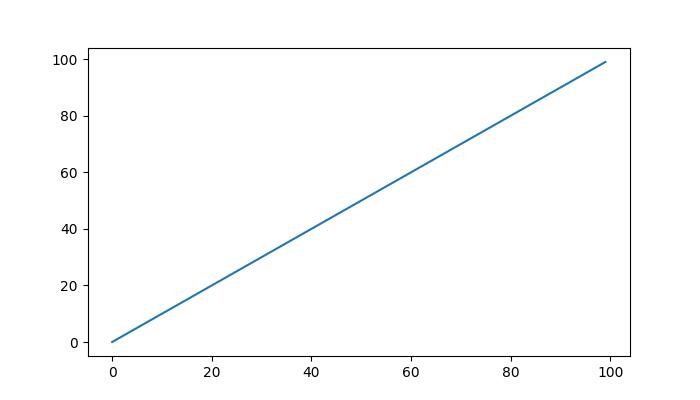
执行上述程序后,您将获得以下图形,滚动鼠标滚轮以观察此绘图中的缩放效果 -

观看下面的视频,观察此滚动事件功能在此处的运行方式。

通过图像进行交互式滚动
Matplotlib 中的滚动事件还可以应用于交互式滚动一系列图像。当浏览多维数据集或图像集合时,此功能特别有用。
示例
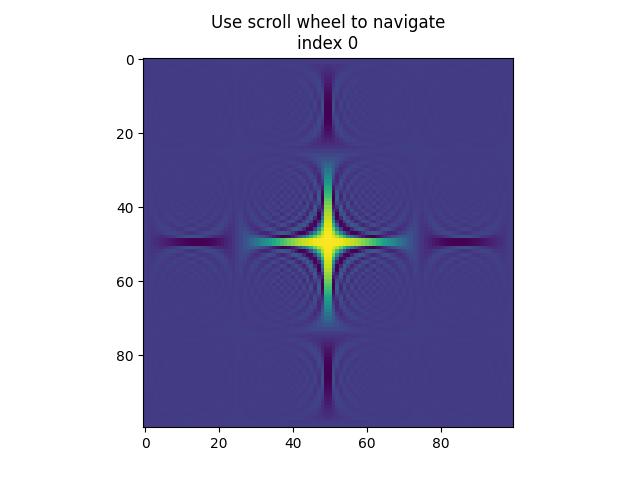
此示例创建了一个 IndexTracker 类,以使用滚动事件浏览一系列 2D 切片。on_scroll 方法根据滚动方向调整索引,然后更新并显示图像。
import matplotlib.pyplot as plt
import numpy as np

class IndexTracker:
   def __init__(self, axs, X):
      self.index = 0
      self.X = X
      self.axs = axs
      self.im = axs.imshow(self.X[:, :, self.index])
      self.update()

   def on_scrolling(self, event):
      print(event.button, event.step)
      increment = 1 if event.button == 'up' else -1
      maxs_index = self.X.shape[-1] - 1
      self.index = np.clip(self.index + increment, 0, maxs_index)
      self.update()

   def update(self):
      self.im.set_data(self.X[:, :, self.index])
      self.axs.set_title(
         f'Use scroll wheel to navigate\nindex {self.index}')
      self.im.axes.figure.canvas.draw()

# 3D data
x, y, z = np.ogrid[-25:25:100j, -25:25:100j, 1:50:100j]
X = np.sin(x * y * z) / (x * y * z)

# Create a figure
fig, axs = plt.subplots()
tracker = IndexTracker(axs, X)

fig.canvas.mpl_connect('scroll_event', tracker.on_scrolling)
plt.show()
输出
执行上述程序后,您将获得以下图形,滚动鼠标滚轮以观察此示例的工作原理 -

up 1.0
up 2.0
down -1.0
down -2.0
down -1.0
up 1.0
up 1.0
down -1.0
down -1.0
up 1.0
up 3.0
down -1.0
down -3.0
观看下面的视频,观察此滚动事件功能在此处的运行方式。

广告