
- Matplotlib 基础
- Matplotlib - 首页
- Matplotlib - 简介
- Matplotlib - 与 Seaborn 的比较
- Matplotlib - 环境设置
- Matplotlib - Anaconda 发行版
- Matplotlib - Jupyter Notebook
- Matplotlib - Pyplot API
- Matplotlib - 简单绘图
- Matplotlib - 保存图表
- Matplotlib - 标记
- Matplotlib - 图表
- Matplotlib - 样式
- Matplotlib - 图例
- Matplotlib - 颜色
- Matplotlib - 颜色映射
- Matplotlib - 颜色映射规范化
- Matplotlib - 选择颜色映射
- Matplotlib - 颜色条
- Matplotlib - 文本
- Matplotlib - 文本属性
- Matplotlib - 子图标题
- Matplotlib - 图片
- Matplotlib - 图片蒙版
- Matplotlib - 注释
- Matplotlib - 箭头
- Matplotlib - 字体
- Matplotlib - 什么是字体?
- 全局设置字体属性
- Matplotlib - 字体索引
- Matplotlib - 字体属性
- Matplotlib - 刻度
- Matplotlib - 线性和对数刻度
- Matplotlib - 对称对数和 Logit 刻度
- Matplotlib - LaTeX
- Matplotlib - 什么是 LaTeX?
- Matplotlib - 用于数学表达式的 LaTeX
- Matplotlib - 注释中的 LaTeX 文本格式
- Matplotlib - PostScript
- 启用注释中的 LaTeX 渲染
- Matplotlib - 数学表达式
- Matplotlib - 动画
- Matplotlib - 绘图元素
- Matplotlib - 使用 Cycler 进行样式设置
- Matplotlib - 路径
- Matplotlib - 路径效果
- Matplotlib - 变换
- Matplotlib - 刻度和刻度标签
- Matplotlib - 弧度刻度
- Matplotlib - 日期刻度
- Matplotlib - 刻度格式化器
- Matplotlib - 刻度定位器
- Matplotlib - 基本单位
- Matplotlib - 自动缩放
- Matplotlib - 反转坐标轴
- Matplotlib - 对数坐标轴
- Matplotlib - Symlog
- Matplotlib - 单位处理
- Matplotlib - 带单位的椭圆
- Matplotlib - 脊柱
- Matplotlib - 坐标轴范围
- Matplotlib - 坐标轴刻度
- Matplotlib - 坐标轴刻度
- Matplotlib - 格式化坐标轴
- Matplotlib - Axes 类
- Matplotlib - 双坐标轴
- Matplotlib - Figure 类
- Matplotlib - 多图
- Matplotlib - 网格
- Matplotlib - 面向对象接口
- Matplotlib - PyLab 模块
- Matplotlib - Subplots() 函数
- Matplotlib - Subplot2grid() 函数
- Matplotlib - 锚定绘图元素
- Matplotlib - 手动等高线
- Matplotlib - 坐标报告
- Matplotlib - AGG 滤镜
- Matplotlib - 功能区
- Matplotlib - 填充螺旋线
- Matplotlib - Findobj 演示
- Matplotlib - 超链接
- Matplotlib - 图片缩略图
- Matplotlib - 使用关键字绘图
- Matplotlib - 创建 Logo
- Matplotlib - 多页 PDF
- Matplotlib - 多进程
- Matplotlib - 打印标准输出
- Matplotlib - 复合路径
- Matplotlib - Sankey 类
- Matplotlib - MRI 与 EEG
- Matplotlib - 样式表
- Matplotlib - 背景颜色
- Matplotlib - Basemap
- Matplotlib 事件处理
- Matplotlib - 事件处理
- Matplotlib - 关闭事件
- Matplotlib - 鼠标移动
- Matplotlib - 点击事件
- Matplotlib - 滚动事件
- Matplotlib - 按键事件
- Matplotlib - 选择事件
- Matplotlib - 透镜
- Matplotlib - 路径编辑器
- Matplotlib - 多边形编辑器
- Matplotlib - 定时器
- Matplotlib - Viewlims
- Matplotlib - 缩放窗口
- Matplotlib 部件
- Matplotlib - 游标部件
- Matplotlib - 带注释的游标
- Matplotlib - 按钮部件
- Matplotlib - 复选框
- Matplotlib - 套索选择器
- Matplotlib - 菜单部件
- Matplotlib - 鼠标游标
- Matplotlib - 多游标
- Matplotlib - 多边形选择器
- Matplotlib - 单选按钮
- Matplotlib - 范围滑块
- Matplotlib - 矩形选择器
- Matplotlib - 椭圆选择器
- Matplotlib - 滑块部件
- Matplotlib - 跨度选择器
- Matplotlib - 文本框
- Matplotlib 绘图
- Matplotlib - 条形图
- Matplotlib - 直方图
- Matplotlib - 饼图
- Matplotlib - 散点图
- Matplotlib - 箱线图
- Matplotlib - 小提琴图
- Matplotlib - 等高线图
- Matplotlib - 3D 绘图
- Matplotlib - 3D 等高线
- Matplotlib - 3D 线框图
- Matplotlib - 3D 表面图
- Matplotlib - 矢羽图
- Matplotlib 有用资源
- Matplotlib - 快速指南
- Matplotlib - 有用资源
- Matplotlib - 讨论
Matplotlib - 游标部件
什么是游标部件?
Matplotlib 游标部件具体是指 Matplotlib 的 widgets 模块中的 Cursor 类。它提供了一种交互式显示绘图坐标和数据值的方法,当游标在绘图上移动时,它会实时显示相应位置的坐标和数据。此功能对于交互式探索数据点或从绘图中获取特定信息特别有用。
游标部件的关键特性
以下是 matplotlb 库游标部件的关键特性。
交互式游标 − Cursor 类创建一个交互式游标,跟踪鼠标指针在 Matplotlib 绘图上移动时的位置。
坐标显示 − 当游标悬停在绘图上时,部件会显示数据坐标中的 x 和 y 坐标,这些坐标对应于游标的位置。
数据值显示 − 我们可以选择配置游标以显示游标位置处的数据值或其他相关信息,这对于可视化特定数据点很有用。
使用游标部件的基本工作流程
以下是游标部件使用情况的基本流程图。
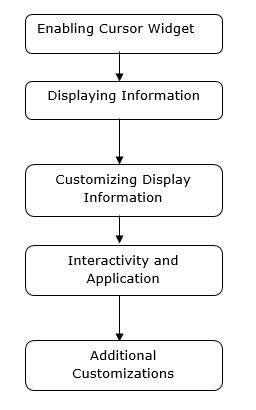
启用游标部件
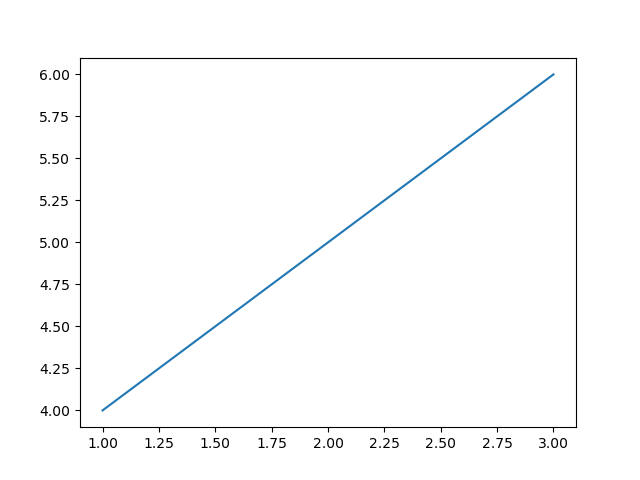
在 Matplotlib 中启用游标部件涉及使用 `plt.connect()` 将一个函数连接到 `'motion_notify_event'` 事件,以处理绘图上的游标移动。
此设置允许我们交互式地在控制台中查看游标的坐标,当我们将它移动到绘图上时。我们可以修改函数 `on_move()` 以执行其他操作或以不同的方式显示信息,这取决于我们的特定需求。
示例
在这个例子中,`on_move()` 是一个处理游标移动事件的函数。它检查游标是否在绘图区域内 (`event.inaxes`) 并检索游标的 x 和 y 坐标 (`event.xdata` 和 `event.ydata`)。`plt.connect('motion_notify_event', on_move)` 将 `'motion_notify_event'` 连接到 `on_move()` 函数,这启用了游标部件。当游标在绘图上移动时,`on_move()` 函数将被触发。
import matplotlib.pyplot as plt
# Function to handle cursor movement
def on_move(event):
   if event.inaxes:  # Check if the cursor is within the plot area
      x, y = event.xdata, event.ydata  # Get cursor position
      print(f'Cursor at x={x:.2f}, y={y:.2f}')  # Display coordinates
# Creating a plot
fig, ax = plt.subplots()
ax.plot([1, 2, 3], [4, 5, 6])
# Connecting the 'motion_notify_event' to the function 'on_move'
plt.connect('motion_notify_event', on_move)
plt.show()
输出
显示信息
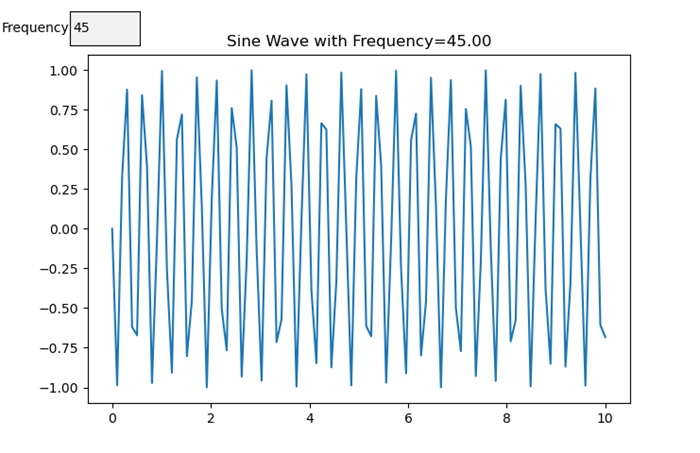
在 Matplotlib 中的自定义部件中显示信息允许我们创建具有自定义元素的交互式绘图,以展示特定信息或增强用户交互。让我们创建一个简单的示例。在这里,我们将频率设置为 45。
示例
import matplotlib.pyplot as plt
from matplotlib.widgets import TextBox, Button
import numpy as np
# Generate sample data
x = np.linspace(0, 10, 100)
y = np.sin(x)
# Create a plot
fig, ax = plt.subplots()
line, = ax.plot(x, y)
# Function to update the plot based on input
def update(text):
   frequency = float(text)  # Get the frequency value from the input
   new_y = np.sin(frequency * x)  # Generate new y values based on frequency
   line.set_ydata(new_y)  # Update the plot
   ax.set_title(f'Sine Wave with Frequency={frequency:.2f}')  # Update plot title
   fig.canvas.draw_idle()  # Redraw the plot
# Create a textbox widget for input
text_box = TextBox(plt.axes([0.1, 0.9, 0.1, 0.075]), 'Frequency')
text_box.on_submit(update)  # Connect the textbox to the update function
# Display the plot
plt.show()
输出
自定义显示信息
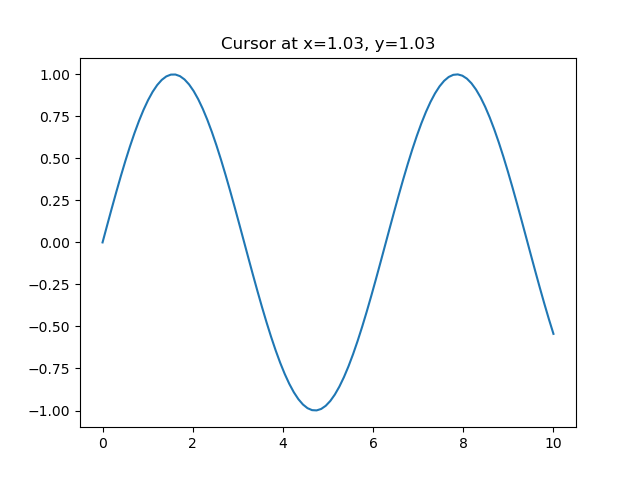
在 Matplotlib 中使用游标部件时,我们可以根据游标在绘图上的位置自定义显示的信息。这是一个如何实现它的示例。
示例
import matplotlib.pyplot as plt
import numpy as np
# Generating sample data
x = np.linspace(0, 10, 100)
y = np.sin(x)
# Creating a plot
fig, ax = plt.subplots()
line, = ax.plot(x, y)
# Function to update displayed information based on cursor position
def update_cursor_info(event):
   if event.inaxes:
      x_cursor, y_cursor = event.xdata, event.ydata
      ax.set_title(f'Cursor at x={x_cursor:.2f}, y={y_cursor:.2f}')
      fig.canvas.draw_idle()
# Connecting the 'motion_notify_event' to update_cursor_info function
plt.connect('motion_notify_event', update_cursor_info)
plt.show()
输出
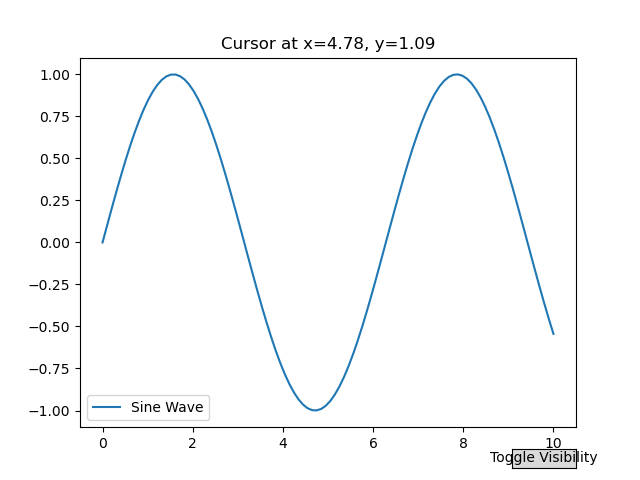
交互性和应用
游标部件中的交互性提供了一种强大的方法来增强用户与绘图的互动。通过使用游标部件,用户可以交互式地探索数据点并获得见解。让我们增强之前的示例以演示交互性和潜在的应用。
示例
import matplotlib.pyplot as plt
import numpy as np
# Generating sample data
x = np.linspace(0, 10, 100)
y = np.sin(x)
# Creating a plot
fig, ax = plt.subplots()
line, = ax.plot(x, y, label='Sine Wave')
# Function to update displayed information based on cursor position
def update_cursor_info(event):
   if event.inaxes:
      x_cursor, y_cursor = event.xdata, event.ydata
      ax.set_title(f'Cursor at x={x_cursor:.2f}, y={y_cursor:.2f}')
      fig.canvas.draw_idle()
# Connecting the 'motion_notify_event' to update_cursor_info function
plt.connect('motion_notify_event', update_cursor_info)
# Adding a legend
ax.legend()
# Adding interactivity with a button to toggle visibility of the sine wave
def toggle_visibility(event):
   current_visibility = line.get_visible()
   line.set_visible(not current_visibility)
   ax.legend().set_visible(not current_visibility)
   fig.canvas.draw_idle()
# Creating a button widget
button_ax = plt.axes([0.8, 0.025, 0.1, 0.04])
toggle_button = plt.Button(button_ax, 'Toggle Visibility')
toggle_button.on_clicked(toggle_visibility)
plt.show()
输出
向曲线添加游标
在这个例子中,我们在 Matplotlib 中向曲线添加了一个游标。
示例
import matplotlib.pyplot as plt
import numpy as np

plt.rcParams["figure.figsize"] = [7.50, 3.50]
plt.rcParams["figure.autolayout"] = True

class CursorClass(object):
   def __init__(self, ax, x, y):
      self.ax = ax
      self.ly = ax.axvline(color='yellow', alpha=0.5)
      self.marker, = ax.plot([0], [0], marker="o", color="red", zorder=3)
      self.x = x
      self.y = y
      self.txt = ax.text(0.7, 0.9, '')

   def mouse_event(self, event):
      if event.inaxes:
         x, y = event.xdata, event.ydata
         indx = np.searchsorted(self.x, [x])[0]
         x = self.x[indx]
         y = self.y[indx]
         self.ly.set_xdata(x)
         self.marker.set_data([x], [y])
         self.txt.set_text('x=%1.2f, y=%1.2f' % (x, y))
         self.txt.set_position((x, y))
         self.ax.figure.canvas.draw_idle()
      else:
         return

t = np.arange(0.0, 1.0, 0.01)
s = np.sin(2 * 2 * np.pi * t)

fig, ax = plt.subplots()

cursor = CursorClass(ax, t, s)
cid = plt.connect('motion_notify_event', cursor.mouse_event)

ax.plot(t, s, lw=2, color='green')
plt.axis([0, 1, -1, 1])

plt.show()
输出
