- Matplotlib 基础
- Matplotlib - 首页
- Matplotlib - 简介
- Matplotlib - 与Seaborn对比
- Matplotlib - 环境搭建
- Matplotlib - Anaconda发行版
- Matplotlib - Jupyter Notebook
- Matplotlib - Pyplot API
- Matplotlib - 简单绘图
- Matplotlib - 保存图片
- Matplotlib - 标记
- Matplotlib - 图表
- Matplotlib - 样式
- Matplotlib - 图例
- Matplotlib - 颜色
- Matplotlib - 颜色映射
- Matplotlib - 颜色映射规范化
- Matplotlib - 选择颜色映射
- Matplotlib - 颜色条
- Matplotlib - 文本
- Matplotlib - 文本属性
- Matplotlib - 子图标题
- Matplotlib - 图片
- Matplotlib - 图片蒙版
- Matplotlib - 注释
- Matplotlib - 箭头
- Matplotlib - 字体
- Matplotlib - 什么是字体?
- 全局设置字体属性
- Matplotlib - 字体索引
- Matplotlib - 字体属性
- Matplotlib - 刻度
- Matplotlib - 线性与对数刻度
- Matplotlib - 对称对数和Logit刻度
- Matplotlib - LaTeX
- Matplotlib - 什么是LaTeX?
- Matplotlib - LaTeX用于数学表达式
- Matplotlib - 在注释中使用LaTeX文本格式
- Matplotlib - PostScript
- 启用注释中的LaTeX渲染
- Matplotlib - 数学表达式
- Matplotlib - 动画
- Matplotlib - 图形对象
- Matplotlib - 使用Cycler进行样式设置
- Matplotlib - 路径
- Matplotlib - 路径效果
- Matplotlib - 变换
- Matplotlib - 刻度和刻度标签
- Matplotlib - 弧度刻度
- Matplotlib - 日期刻度
- Matplotlib - 刻度格式化器
- Matplotlib - 刻度定位器
- Matplotlib - 基本单位
- Matplotlib - 自动缩放
- Matplotlib - 反转坐标轴
- Matplotlib - 对数坐标轴
- Matplotlib - Symlog
- Matplotlib - 单位处理
- Matplotlib - 带单位的椭圆
- Matplotlib - 脊柱
- Matplotlib - 坐标轴范围
- Matplotlib - 坐标轴刻度
- Matplotlib - 坐标轴刻度
- Matplotlib - 格式化坐标轴
- Matplotlib - Axes类
- Matplotlib - 双坐标轴
- Matplotlib - Figure类
- Matplotlib - 多图
- Matplotlib - 网格
- Matplotlib - 面向对象接口
- Matplotlib - PyLab模块
- Matplotlib - subplots()函数
- Matplotlib - subplot2grid()函数
- Matplotlib - 固定位置的图形对象
- Matplotlib - 手动等高线
- Matplotlib - 坐标报告
- Matplotlib - AGG滤镜
- Matplotlib - 飘带框
- Matplotlib - 填充螺旋线
- Matplotlib - findobj演示
- Matplotlib - 超链接
- Matplotlib - 图片缩略图
- Matplotlib - 使用关键字绘图
- Matplotlib - 创建Logo
- Matplotlib - 多页PDF
- Matplotlib - 多进程
- Matplotlib - 打印标准输出
- Matplotlib - 复合路径
- Matplotlib - Sankey类
- Matplotlib - MRI与EEG
- Matplotlib - 样式表
- Matplotlib - 背景颜色
- Matplotlib - Basemap
- Matplotlib 事件处理
- Matplotlib - 事件处理
- Matplotlib - 关闭事件
- Matplotlib - 鼠标移动
- Matplotlib - 点击事件
- Matplotlib - 滚动事件
- Matplotlib - 按键事件
- Matplotlib - 选择事件
- Matplotlib - 透视镜
- Matplotlib - 路径编辑器
- Matplotlib - 多边形编辑器
- Matplotlib - 定时器
- Matplotlib - viewlims
- Matplotlib - 缩放窗口
- Matplotlib 控件
- Matplotlib - 游标控件
- Matplotlib - 带注释的游标
- Matplotlib - 按钮控件
- Matplotlib - 复选框
- Matplotlib - 套索选择器
- Matplotlib - 菜单控件
- Matplotlib - 鼠标游标
- Matplotlib - 多游标
- Matplotlib - 多边形选择器
- Matplotlib - 单选按钮
- Matplotlib - RangeSlider
- Matplotlib - 矩形选择器
- Matplotlib - 椭圆选择器
- Matplotlib - 滑块控件
- Matplotlib - 区间选择器
- Matplotlib - 文本框
- Matplotlib 绘图
- Matplotlib - 条形图
- Matplotlib - 直方图
- Matplotlib - 饼图
- Matplotlib - 散点图
- Matplotlib - 箱线图
- Matplotlib - 小提琴图
- Matplotlib - 等高线图
- Matplotlib - 3D绘图
- Matplotlib - 3D等高线
- Matplotlib - 3D线框图
- Matplotlib - 3D曲面图
- Matplotlib - 矢羽图
- Matplotlib 有用资源
- Matplotlib - 快速指南
- Matplotlib - 有用资源
- Matplotlib - 讨论
Matplotlib - PostScript
PostScript 是一种页面描述语言和动态类型、基于堆栈的编程语言,通常缩写为 PS。它由Adobe Systems公司在20世纪80年代初创建,其主要目的是描述打印页面的布局和图形。它广泛用于电子出版和桌面出版应用程序。
PostScript文件可以在不同的设备上打印或显示而不会损失质量。这是生成用于不同目的的绘图的关键优势。
Matplotlib中的PostScript
在Matplotlib的上下文中,PostScript充当后端渲染引擎(用于在屏幕上显示图形或写入文件),使用户能够生成出版质量的绘图和图形。当您选择PostScript后端时,Matplotlib会生成PostScript代码来描述绘图的布局和外观。
Matplotlib生成的PostScript代码包括用于在页面上绘制线条、形状、文本和其他图形元素的指令。这些指令是用PostScript编程语言编写的。
Matplotlib PostScript后端(matplotlib.backends.backend_ps)可以生成.ps和.eps文件。
创建PostScript文件
让我们探讨如何使用Matplotlib创建一个简单的绘图并将其保存为PostScript文件。
示例1
此示例演示如何创建一个带有换行文本的简单绘图并将其保存为PostScript文件(.ps)。
import matplotlib
import matplotlib.pyplot as plt

import textwrap
from pylab import *

# Generate a string containing printable characters (ASCII 32 to 126)
text_to_wrap = "".join(c for c in map(chr, range(32, 127)) if c.isprintable())

# Wrap the string to fit within the figure
wrapped_text = "\n".join(textwrap.wrap(text_to_wrap))

# Add the wrapped text to the figure
figtext(0, 0.5, wrapped_text)

# Save the figure to a PostScript file named "test.ps"
savefig("test.ps")
print('Successfully created the PostScript (PS) file...')
输出
如果您访问保存输出的文件夹,您可以看到名为test.ps的生成的PostScript文件。
Successfully created the PostScript (PS) file...
示例2
这是一个示例,演示如何使用PostScript后端生成绘图并将其保存到封装的PostScript (EPS) 文件。
import numpy as np
from matplotlib import pyplot as plt

# Generate data
x_data = np.linspace(1, 10, 100)
y_data = np.sin(x_data)

# Create the plot
plt.plot(x_data, y_data, c='green', marker='o')
plt.grid()

# Save the figure to a PostScript file named "example.eps"
plt.savefig("example.eps")

print('Successfully created the encapsulated PostScript (EPS) file...')
输出
如果您访问保存输出的文件夹,您可以看到名为example.eps的生成的PostScript文件。
Successfully created the encapsulated PostScript (EPS) file...
自定义PostScript输出
调整Matplotlib中的PostScript输出设置允许您增强封装PostScript (EPS) 文件的视觉质量。默认情况下,Matplotlib在创建EPS文件时使用蒸馏过程。此蒸馏步骤会删除LaTeX认为在EPS文件中非法的特定PostScript操作符。
一种有效的解决方法包括修改分辨率参数以获得更好的视觉效果。rcParams["ps.distiller.res"]参数控制EPS文件的分辨率,默认值为6000。增加此值会导致文件更大,但可能会显著提高视觉质量并保持合理的缩放比例。
示例1
此示例演示如何调整分辨率参数可以增强EPS文件的视觉质量。
import numpy as np
import matplotlib.pyplot as plt

# Set the resolution for EPS files
plt.rcParams["ps.distiller.res"] = 12000

# Set the figure size and enable autolayout
plt.rcParams["figure.figsize"] = [7, 3.50]
plt.rcParams["figure.autolayout"] = True

# Generate data
x_data = np.linspace(1, 10, 100)
y_data = np.sin(x_data)

# Plotting
plt.plot(x_data, y_data, label='Sine Wave', color='green')

# Save the figure as an EPS file
plt.savefig('Output customized file.eps', format='eps', bbox_inches='tight')
print('Successfully created the output customized PostScript (EPS) file...')
输出
如果您访问保存输出的文件夹,您可以看到名为Output customized file.eps的生成的PostScript文件。
Successfully created the output customized PostScript (EPS) file...
示例2
这是一个示例,演示了通过在savefig()函数中设置transparent=True参数如何在将绘图保存为.eps文件时保留透明度。
import numpy as np
import matplotlib.pyplot as plt

# Adjust figure size and autolayout
plt.rcParams["figure.figsize"] = [7.50, 3.50]
plt.rcParams["figure.autolayout"] = True

# Generate data
x_data = np.linspace(1, 10, 100)
y_data = np.sin(x_data)

# Plot data with transparency
plt.plot(x_data, y_data, c='green', marker='o', alpha=.35, ms=10, lw=1)
plt.grid()

# Save plot as .eps by preserving the transparency
plt.savefig("lost_transparency_img.eps", transparent=True)

# Display plot
plt.show()
输出
执行上述代码后,您将获得以下输出:
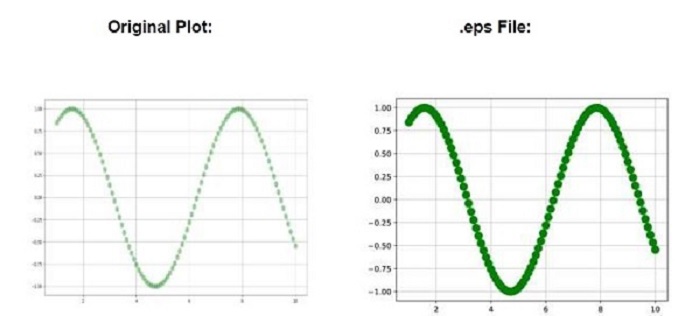
每当绘图保存为.eps/.ps时,绘图的透明度就会丢失。您可以观察以上图片中的差异。