- Matplotlib 基础
- Matplotlib - 首页
- Matplotlib - 简介
- Matplotlib - 与 Seaborn 的比较
- Matplotlib - 环境搭建
- Matplotlib - Anaconda 发行版
- Matplotlib - Jupyter Notebook
- Matplotlib - Pyplot API
- Matplotlib - 简单绘图
- Matplotlib - 保存图片
- Matplotlib - 标记
- Matplotlib - 图形
- Matplotlib - 风格
- Matplotlib - 图例
- Matplotlib - 颜色
- Matplotlib - 颜色图
- Matplotlib - 颜色图归一化
- Matplotlib - 选择颜色图
- Matplotlib - 颜色条
- Matplotlib - 文本
- Matplotlib - 文本属性
- Matplotlib - 子图标题
- Matplotlib - 图片
- Matplotlib - 图片蒙版
- Matplotlib - 注释
- Matplotlib - 箭头
- Matplotlib - 字体
- Matplotlib - 什么是字体?
- 全局设置字体属性
- Matplotlib - 字体索引
- Matplotlib - 字体属性
- Matplotlib - 比例尺
- Matplotlib - 线性与对数比例尺
- Matplotlib - 对称对数与Logit比例尺
- Matplotlib - LaTeX
- Matplotlib - 什么是LaTeX?
- Matplotlib - 用于数学表达式的LaTeX
- Matplotlib - 注释中的LaTeX文本格式
- Matplotlib - PostScript
- 启用注释中的LaTeX渲染
- Matplotlib - 数学表达式
- Matplotlib - 动画
- Matplotlib - 图形元素
- Matplotlib - 使用Cycler进行样式设置
- Matplotlib - 路径
- Matplotlib - 路径效果
- Matplotlib - 变换
- Matplotlib - 刻度和刻度标签
- Matplotlib - 弧度刻度
- Matplotlib - 日期刻度
- Matplotlib - 刻度格式化器
- Matplotlib - 刻度定位器
- Matplotlib - 基本单位
- Matplotlib - 自动缩放
- Matplotlib - 反转坐标轴
- Matplotlib - 对数坐标轴
- Matplotlib - Symlog
- Matplotlib - 单位处理
- Matplotlib - 带单位的椭圆
- Matplotlib - 脊柱
- Matplotlib - 坐标轴范围
- Matplotlib - 坐标轴比例尺
- Matplotlib - 坐标轴刻度
- Matplotlib - 坐标轴格式化
- Matplotlib - Axes 类
- Matplotlib - 双坐标轴
- Matplotlib - Figure 类
- Matplotlib - 多图
- Matplotlib - 网格
- Matplotlib - 面向对象接口
- Matplotlib - PyLab 模块
- Matplotlib - Subplots() 函数
- Matplotlib - Subplot2grid() 函数
- Matplotlib - 锚定图形元素
- Matplotlib - 手动等高线
- Matplotlib - 坐标报告
- Matplotlib - AGG 滤镜
- Matplotlib - 缎带框
- Matplotlib - 填充螺旋线
- Matplotlib - Findobj 演示
- Matplotlib - 超链接
- Matplotlib - 图片缩略图
- Matplotlib - 使用关键字绘图
- Matplotlib - 创建Logo
- Matplotlib - 多页 PDF
- Matplotlib - 多进程
- Matplotlib - 打印标准输出
- Matplotlib - 复合路径
- Matplotlib - Sankey 类
- Matplotlib - MRI 与 EEG
- Matplotlib - 样式表
- Matplotlib - 背景颜色
- Matplotlib - Basemap
- Matplotlib 事件处理
- Matplotlib - 事件处理
- Matplotlib - 关闭事件
- Matplotlib - 鼠标移动
- Matplotlib - 点击事件
- Matplotlib - 滚动事件
- Matplotlib - 按键事件
- Matplotlib - 选择事件
- Matplotlib - 透镜
- Matplotlib - 路径编辑器
- Matplotlib - 多边形编辑器
- Matplotlib - 定时器
- Matplotlib - Viewlims
- Matplotlib - 缩放窗口
- Matplotlib 小部件
- Matplotlib - 光标小部件
- Matplotlib - 带注释的光标
- Matplotlib - 按钮小部件
- Matplotlib - 复选框
- Matplotlib - 套索选择器
- Matplotlib - 菜单小部件
- Matplotlib - 鼠标光标
- Matplotlib - 多光标
- Matplotlib - 多边形选择器
- Matplotlib - 单选按钮
- Matplotlib - RangeSlider
- Matplotlib - 矩形选择器
- Matplotlib - 椭圆选择器
- Matplotlib - 滑块小部件
- Matplotlib - Span 选择器
- Matplotlib - 文本框
- Matplotlib 绘图
- Matplotlib - 条形图
- Matplotlib - 直方图
- Matplotlib - 饼图
- Matplotlib - 散点图
- Matplotlib - 箱线图
- Matplotlib - 小提琴图
- Matplotlib - 等高线图
- Matplotlib - 3D 绘图
- Matplotlib - 3D 等高线
- Matplotlib - 3D 线框图
- Matplotlib - 3D 表面图
- Matplotlib - 矢羽图
- Matplotlib 有用资源
- Matplotlib - 快速指南
- Matplotlib - 有用资源
- Matplotlib - 讨论
Matplotlib - 多页 PDF
一个多页PDF(便携式文档格式)是一种文件类型,可以将多个页面或图像存储在一个文档中。PDF中的每个页面都可以具有不同的内容,例如图表、图像或文本。
Matplotlib 通过其backend_pdf.PdfPages模块提供创建多页PDF的支持。此功能允许用户在同一个PDF文件中跨多个页面保存绘图和可视化结果。
在某些情况下,需要将多个绘图保存到一个文件中。虽然许多图像文件格式(如PNG、SVG或JPEG)通常只支持每个文件一个图像,但Matplotlib提供了一种创建多页输出的解决方案。PDF就是这样一种支持的格式,它允许用户有效地组织和共享可视化结果。
创建基本的 多页 PDF
要使用Matplotlib在PDF文档中保存多个页面的绘图,可以使用PdfPages类。此类简化了生成包含多个页面的PDF文件的过程,每个页面包含不同的可视化结果。
示例
让我们从一个基本的示例开始,演示如何使用Matplotlib创建多页PDF。此示例将多个图形一次性保存到一个PDF文件中。
from matplotlib.backends.backend_pdf import PdfPages
import numpy as np
import matplotlib.pyplot as plt

# sample data for plots
x1 = np.arange(10)
y1 = x1**2

x2 = np.arange(20)
y2 = x2**2

# Create a PdfPages object to save the pages
pp = PdfPages('Basic_multipage_pdf.pdf')

def function_plot(X,Y):
   plt.figure()
   plt.clf()

   plt.plot(X,Y)
   plt.title('y vs x')
   plt.xlabel('x axis', fontsize = 13)
   plt.ylabel('y axis', fontsize = 13)
   pp.savefig()

# Create and save the first plot
function_plot(x1,y1)
# Create and save the second plot
function_plot(x2,y2)

pp.close()
输出
执行上述程序后,将在保存脚本的目录中生成'Basic_multipage_pdf.pdf'。

添加元数据和注释
Matplotlib还支持向多页PDF添加元数据和注释。元数据可以包括标题、作者和创建日期等信息,为PDF中的内容提供额外的上下文或详细信息。
示例
这是一个高级示例,它创建一个包含元数据和注释的多页PDF。
import datetime
import matplotlib.pyplot as plt
import numpy as np
from matplotlib.backends.backend_pdf import PdfPages

# Create the PdfPages object to save the pages
with PdfPages('Advanced_multipage_pdf.pdf') as pdf:

   # Page One
   plt.figure(figsize=(3, 3))
   plt.plot(range(7), [3, 1, 4, 1, 5, 9, 2], 'r-o')
   plt.title('Page One')
   # saves the current figure into a pdf page
   pdf.savefig()
   plt.close()

   # Page Two

   # Initially set it to True. If LaTeX is not installed or an error is caught, change to `False`
   # The usetex setting is particularly useful when you need LaTeX features that aren't present in matplotlib's built-in mathtext.
   plt.rcParams['text.usetex'] = False
   plt.figure(figsize=(8, 6))
   x = np.arange(0, 5, 0.1)
   plt.plot(x, np.sin(x), 'b-')
   plt.title('Page Two')
   # attach metadata (as pdf note) to page
   pdf.attach_note("plot of sin(x)")
   pdf.savefig()
   plt.close()

   # Page Three
   plt.rcParams['text.usetex'] = False
   fig = plt.figure(figsize=(4, 5))
   plt.plot(x, x ** 2, 'ko')
   plt.title('Page Three')
   pdf.savefig(fig)
   plt.close()

   # Set file metadata
   d = pdf.infodict()
   d['Title'] = 'Multipage PDF Example'
   d['Author'] = 'Tutorialspoint'
   d['Subject'] = 'How to create a multipage pdf file and set its metadata'
   d['Keywords'] = 'PdfPages multipage keywords author title subject'
   d['CreationDate'] = datetime.datetime(2024, 1, 15)
   d['ModDate'] = datetime.datetime.today()
输出
执行上述程序后,将在保存脚本的目录中生成'Advanced_multipage_pdf.pdf'。您将能够观察到如下详细信息:
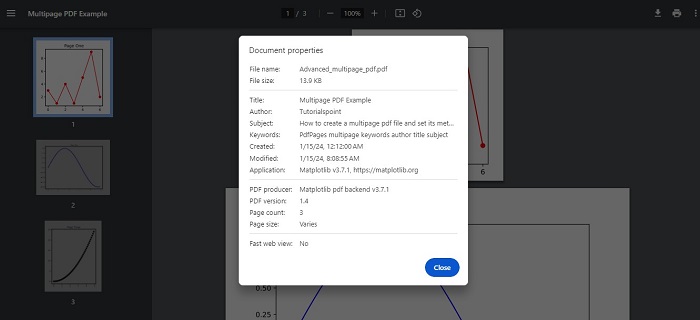
广告