- Matplotlib 基础
- Matplotlib - 首页
- Matplotlib - 简介
- Matplotlib - 与 Seaborn 的比较
- Matplotlib - 环境设置
- Matplotlib - Anaconda 发行版
- Matplotlib - Jupyter Notebook
- Matplotlib - Pyplot API
- Matplotlib - 简单绘图
- Matplotlib - 保存图片
- Matplotlib - 标记
- Matplotlib - 图表
- Matplotlib - 样式
- Matplotlib - 图例
- Matplotlib - 颜色
- Matplotlib - 颜色映射
- Matplotlib - 颜色映射归一化
- Matplotlib - 选择颜色映射
- Matplotlib - 颜色条
- Matplotlib - 文本
- Matplotlib - 文本属性
- Matplotlib - 子图标题
- Matplotlib - 图片
- Matplotlib - 图片蒙版
- Matplotlib - 注释
- Matplotlib - 箭头
- Matplotlib - 字体
- Matplotlib - 什么是字体?
- 全局设置字体属性
- Matplotlib - 字体索引
- Matplotlib - 字体属性
- Matplotlib - 刻度
- Matplotlib - 线性刻度和对数刻度
- Matplotlib - 对称对数刻度和logit刻度
- Matplotlib - LaTeX
- Matplotlib - 什么是LaTeX?
- Matplotlib - LaTeX用于数学表达式
- Matplotlib - 在注释中使用LaTeX文本格式
- Matplotlib - PostScript
- 启用注释中的LaTeX渲染
- Matplotlib - 数学表达式
- Matplotlib - 动画
- Matplotlib - 绘图元素
- Matplotlib - 使用Cycler进行样式设置
- Matplotlib - 路径
- Matplotlib - 路径效果
- Matplotlib - 变换
- Matplotlib - 刻度和刻度标签
- Matplotlib - 弧度刻度
- Matplotlib - 日期刻度
- Matplotlib - 刻度格式化器
- Matplotlib - 刻度定位器
- Matplotlib - 基本单位
- Matplotlib - 自动缩放
- Matplotlib - 反转坐标轴
- Matplotlib - 对数坐标轴
- Matplotlib - Symlog
- Matplotlib - 单位处理
- Matplotlib - 带单位的椭圆
- Matplotlib - 脊柱
- Matplotlib - 坐标轴范围
- Matplotlib - 坐标轴刻度
- Matplotlib - 坐标轴刻度
- Matplotlib - 格式化坐标轴
- Matplotlib - Axes 类
- Matplotlib - 双坐标轴
- Matplotlib - Figure 类
- Matplotlib - 多图
- Matplotlib - 网格
- Matplotlib - 面向对象接口
- Matplotlib - PyLab 模块
- Matplotlib - Subplots() 函数
- Matplotlib - Subplot2grid() 函数
- Matplotlib - 固定位置的绘图元素
- Matplotlib - 手动等高线
- Matplotlib - 坐标报告
- Matplotlib - AGG 过滤器
- Matplotlib - 带状框
- Matplotlib - 填充螺旋线
- Matplotlib - findobj 演示
- Matplotlib - 超链接
- Matplotlib - 图片缩略图
- Matplotlib - 使用关键字绘图
- Matplotlib - 创建Logo
- Matplotlib - 多页PDF
- Matplotlib - 多进程
- Matplotlib - 打印标准输出
- Matplotlib - 复合路径
- Matplotlib - Sankey 类
- Matplotlib - MRI 与 EEG
- Matplotlib - 样式表
- Matplotlib - 背景颜色
- Matplotlib - Basemap
- Matplotlib 事件处理
- Matplotlib - 事件处理
- Matplotlib - 关闭事件
- Matplotlib - 鼠标移动
- Matplotlib - 点击事件
- Matplotlib - 滚动事件
- Matplotlib - 按键事件
- Matplotlib - 选择事件
- Matplotlib - 透视镜
- Matplotlib - 路径编辑器
- Matplotlib - 多边形编辑器
- Matplotlib - 定时器
- Matplotlib - 视图限制
- Matplotlib - 缩放窗口
- Matplotlib 小部件
- Matplotlib - 光标小部件
- Matplotlib - 带注释的光标
- Matplotlib - 按钮小部件
- Matplotlib - 复选框
- Matplotlib - 套索选择器
- Matplotlib - 菜单小部件
- Matplotlib - 鼠标光标
- Matplotlib - 多光标
- Matplotlib - 多边形选择器
- Matplotlib - 单选按钮
- Matplotlib - 范围滑块
- Matplotlib - 矩形选择器
- Matplotlib - 椭圆选择器
- Matplotlib - 滑块小部件
- Matplotlib - 跨度选择器
- Matplotlib - 文本框
- Matplotlib 绘图
- Matplotlib - 条形图
- Matplotlib - 直方图
- Matplotlib - 饼图
- Matplotlib - 散点图
- Matplotlib - 箱线图
- Matplotlib - 小提琴图
- Matplotlib - 等高线图
- Matplotlib - 3D 绘图
- Matplotlib - 3D 等高线
- Matplotlib - 3D 线框图
- Matplotlib - 3D 表面图
- Matplotlib - 矢羽图
- Matplotlib 有用资源
- Matplotlib - 快速指南
- Matplotlib - 有用资源
- Matplotlib - 讨论
Matplotlib - 鼠标光标
简介
Matplotlib 本身没有特定的鼠标光标小部件,但是 Matplotlib 库提供了各种与鼠标光标交互的机制,允许开发者增强绘图的交互性。让我们详细探讨这些方面。
开发者可以利用这些事件来增强绘图的交互性,跟踪光标位置并以自定义方式响应用户操作。更改光标样式的能力进一步丰富了用户在探索数据可视化时的体验。
处理 Matplotlib 中的鼠标事件
Matplotlib 提供了mpl_connect函数,它允许我们将回调函数连接到各种事件,例如鼠标事件。此功能使我们能够捕获鼠标移动、点击以及 Matplotlib 绘图中的其他交互。
Matplotlib 提供了鼠标交互的事件处理,允许我们捕获鼠标相关的事件,例如按钮点击、鼠标移动和滚动。此功能对于创建交互式绘图至关重要。
以下是 Matplotlib 库中常见的鼠标事件,让我们来看看它们。
button_press_event 和 button_release_event
当按下鼠标按钮时触发button_press_event,当释放鼠标时触发button_release_event。我们可以用它们来捕获鼠标按钮的状态。
motion_notify_event
当鼠标移动时触发此事件。它对于跟踪鼠标光标的位置并相应地更新绘图很有用。
scroll_event
当使用鼠标滚轮时触发此事件。它允许我们响应滚动操作。
检索光标坐标
为了获取绘图中鼠标光标的坐标,我们可以使用event.xdata和event.ydata属性,它们分别表示对应于光标位置的数据坐标。motion_notify_event通常用于跟踪鼠标移动。
显示光标坐标
为了显示光标坐标,我们可以组合使用两个函数on_mouse_move()和fig.canvas.mpl_connect()。
on_mouse_move(event) - 此函数在鼠标移动时触发。它检查光标是否在绘图event.inaxes内,然后打印光标坐标。
fig.canvas.mpl_connect('motion_notify_event', on_mouse_move) - 此行将鼠标移动事件连接到on_mouse_move函数。
示例
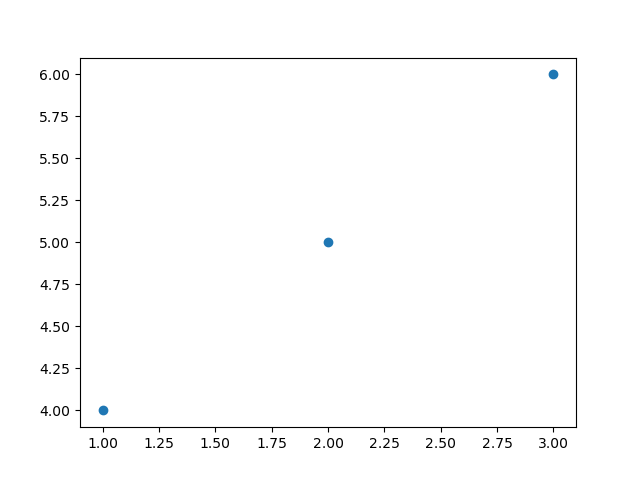
在这个例子中,我们显示了 matplotlib 绘图的光标坐标。
import matplotlib.pyplot as plt
# Function to be triggered on mouse movement
def on_mouse_move(event):
   if event.inaxes:
      x_cursor, y_cursor = event.xdata, event.ydata
      print(f"Cursor at x={x_cursor}, y={y_cursor}")
# Creating a figure and axes
fig, ax = plt.subplots()
# Displaying a plot (for illustration)
ax.scatter([1, 2, 3], [4, 5, 6])
# Connecting the mouse movement event to the on_mouse_move function
fig.canvas.mpl_connect('motion_notify_event', on_mouse_move)
plt.show()
输出

Cursor at x=2.2306451612903224, y=5.127380952380952
Cursor at x=2.23508064516129, y=5.127380952380952
Cursor at x=2.23508064516129, y=5.121428571428572
Cursor at x=2.239516129032258, y=5.121428571428572
Cursor at x=2.2439516129032255, y=5.121428571428572
Cursor at x=2.2483870967741932, y=5.121428571428572
Cursor at x=2.2483870967741932, y=5.1154761904761905
Cursor at x=2.2528225806451614, y=5.1154761904761905
Cursor at x=2.257258064516129, y=5.1154761904761905
----------------------------------------------------
----------------------------------------------------
Cursor at x=2.0, y=5.591666666666667
Cursor at x=2.013306451612903, y=5.728571428571429
Cursor at x=2.013306451612903, y=5.817857142857143
Cursor at x=2.013306451612903, y=5.895238095238096
Cursor at x=2.013306451612903, y=5.966666666666667
Cursor at x=2.0044354838709677, y=6.026190476190476
Cursor at x=1.9955645161290323, y=6.085714285714285
Cursor at x=2.9314516129032255, y=4.014285714285714
响应鼠标点击
我们还可以使用button_press_event或button_release_event事件来响应鼠标点击。
import matplotlib.pyplot as plt
# Function to be triggered on mouse click
def on_mouse_click(event):
   if event.inaxes:
      x_click, y_click = event.xdata, event.ydata
      print(f"Mouse clicked at x={x_click}, y={y_click}")
# Creating a figure and axes
fig, ax = plt.subplots()
# Displaying a plot (for illustration)
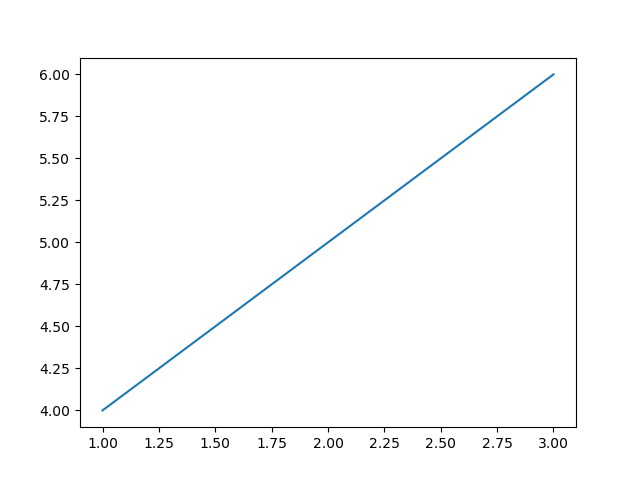
ax.plot([1, 2, 3], [4, 5, 6])
# Connecting the mouse click event to the on_mouse_click function
fig.canvas.mpl_connect('button_press_event', on_mouse_click)
plt.show()
输出

Mouse clicked at x=0.9975806451612903, y=4.002380952380952
Mouse clicked at x=0.9354838709677418, y=5.9904761904761905
创建自定义鼠标光标
虽然 Matplotlib 没有提供特定的鼠标光标小部件,但我们可以在光标位置创建自定义可视化或注释来模拟光标效果。例如,我们可以使用annotate函数在光标移动时动态显示信息。
示例
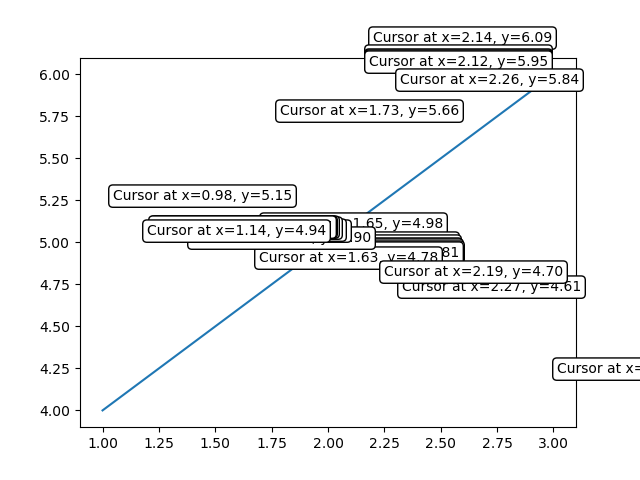
在这个例子中,annotate()函数用于在鼠标移动时动态显示光标坐标。调用plt.draw()方法以实时更新绘图。
import matplotlib.pyplot as plt
# Function to be triggered on mouse movement
def on_mouse_move(event):
   if event.inaxes:
      x_cursor, y_cursor = event.xdata, event.ydata
      ax.annotate(f'Cursor at x={x_cursor:.2f}, y={y_cursor:.2f}',
         xy=(x_cursor, y_cursor), xytext=(10, 10),
         textcoords='offset points', ha='left', va='bottom',
         bbox=dict(boxstyle='round,pad=0.3', edgecolor='black', facecolor='white'))
      plt.draw()
# Creating a figure and axes
fig, ax = plt.subplots()
# Displaying a plot (for illustration)
ax.plot([1, 2, 3], [4, 5, 6])
# Connecting the mouse movement event to the on_mouse_move function
fig.canvas.mpl_connect('motion_notify_event', on_mouse_move)
plt.show()
输出

用例
以下是鼠标小部件的用例。
交互式数据探索 - 跟踪鼠标光标位置允许用户交互式地探索绘图上的数据点。
坐标选择 - 通过捕获鼠标点击,我们可以使用户能够选择特定的坐标或感兴趣的区域。
自定义交互 - 利用鼠标事件,我们可以根据用户操作(例如突出显示数据点或触发特定函数)实现自定义交互。