- Matplotlib 基础
- Matplotlib - 首页
- Matplotlib - 简介
- Matplotlib - 与 Seaborn 的比较
- Matplotlib - 环境设置
- Matplotlib - Anaconda 发行版
- Matplotlib - Jupyter Notebook
- Matplotlib - Pyplot API
- Matplotlib - 简单绘图
- Matplotlib - 保存图形
- Matplotlib - 标记
- Matplotlib - 图形
- Matplotlib - 样式
- Matplotlib - 图例
- Matplotlib - 颜色
- Matplotlib - 色图
- Matplotlib - 色图归一化
- Matplotlib - 选择色图
- Matplotlib - 色标
- Matplotlib - 文本
- Matplotlib - 文本属性
- Matplotlib - 子图标题
- Matplotlib - 图像
- Matplotlib - 图像掩码
- Matplotlib - 注释
- Matplotlib - 箭头
- Matplotlib - 字体
- Matplotlib - 什么是字体?
- 全局设置字体属性
- Matplotlib - 字体索引
- Matplotlib - 字体属性
- Matplotlib - 刻度
- Matplotlib - 线性和对数刻度
- Matplotlib - 对称对数和 Logit 刻度
- Matplotlib - LaTeX
- Matplotlib - 什么是 LaTeX?
- Matplotlib - LaTeX 用于数学表达式
- Matplotlib - LaTeX 在注释中的文本格式化
- Matplotlib - PostScript
- 在注释中启用 LaTeX 渲染
- Matplotlib - 数学表达式
- Matplotlib - 动画
- Matplotlib - 图形对象
- Matplotlib - 使用 Cycler 进行样式设置
- Matplotlib - 路径
- Matplotlib - 路径效果
- Matplotlib - 变换
- Matplotlib - 刻度和刻度标签
- Matplotlib - 弧度刻度
- Matplotlib - 日期刻度
- Matplotlib - 刻度格式化器
- Matplotlib - 刻度定位器
- Matplotlib - 基本单位
- Matplotlib - 自动缩放
- Matplotlib - 反转轴
- Matplotlib - 对数轴
- Matplotlib - Symlog
- Matplotlib - 单位处理
- Matplotlib - 带有单位的椭圆
- Matplotlib - 脊柱
- Matplotlib - 轴范围
- Matplotlib - 轴刻度
- Matplotlib - 轴刻度
- Matplotlib - 格式化轴
- Matplotlib - Axes 类
- Matplotlib - 双轴
- Matplotlib - Figure 类
- Matplotlib - 多图
- Matplotlib - 网格
- Matplotlib - 面向对象接口
- Matplotlib - PyLab 模块
- Matplotlib - Subplots() 函数
- Matplotlib - Subplot2grid() 函数
- Matplotlib - 固定图形对象
- Matplotlib - 手动等值线
- Matplotlib - 坐标报告
- Matplotlib - AGG 过滤器
- Matplotlib - 带状框
- Matplotlib - 填充螺旋
- Matplotlib - Findobj 演示
- Matplotlib - 超链接
- Matplotlib - 图像缩略图
- Matplotlib - 使用关键字绘图
- Matplotlib - 创建徽标
- Matplotlib - 多页 PDF
- Matplotlib - 多进程
- Matplotlib - 打印标准输出
- Matplotlib - 复合路径
- Matplotlib - Sankey 类
- Matplotlib - MRI 与 EEG
- Matplotlib - 样式表
- Matplotlib - 背景颜色
- Matplotlib - Basemap
- Matplotlib 事件处理
- Matplotlib - 事件处理
- Matplotlib - 关闭事件
- Matplotlib - 鼠标移动
- Matplotlib - 点击事件
- Matplotlib - 滚动事件
- Matplotlib - 按键事件
- Matplotlib - 选择事件
- Matplotlib - 放大镜
- Matplotlib - 路径编辑器
- Matplotlib - 多边形编辑器
- Matplotlib - 定时器
- Matplotlib - Viewlims
- Matplotlib - 缩放窗口
- Matplotlib 小部件
- Matplotlib - 光标小部件
- Matplotlib - 带注释的光标
- Matplotlib - 按钮小部件
- Matplotlib - 复选框
- Matplotlib - 套索选择器
- Matplotlib - 菜单小部件
- Matplotlib - 鼠标光标
- Matplotlib - 多光标
- Matplotlib - 多边形选择器
- Matplotlib - 单选按钮
- Matplotlib - 范围滑块
- Matplotlib - 矩形选择器
- Matplotlib - 椭圆选择器
- Matplotlib - 滑块小部件
- Matplotlib - 跨度选择器
- Matplotlib - 文本框
- Matplotlib 绘图
- Matplotlib - 条形图
- Matplotlib - 直方图
- Matplotlib - 饼图
- Matplotlib - 散点图
- Matplotlib - 箱线图
- Matplotlib - 小提琴图
- Matplotlib - 等值线图
- Matplotlib - 3D 绘图
- Matplotlib - 3D 等值线
- Matplotlib - 3D 线框图
- Matplotlib - 3D 表面图
- Matplotlib - 矢羽图
- Matplotlib 有用资源
- Matplotlib - 快速指南
- Matplotlib - 有用资源
- Matplotlib - 讨论
Matplotlib - 直方图
直方图就像一个视觉摘要,它显示了数据集中不同值出现的频率。想象一下,你有一组数字,比如人们的年龄。直方图将这些数字分成组,称为“区间”,然后使用条形表示每个区间中有多少个数字。条形越高,该组中的数字就越多。
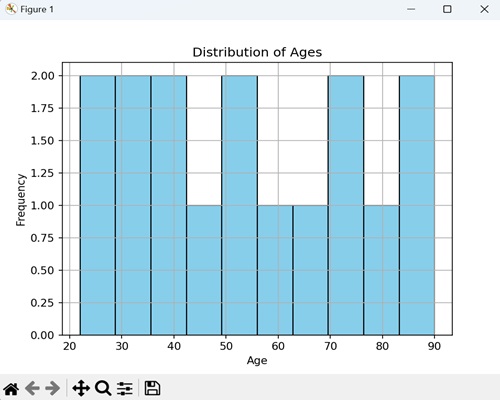
Matplotlib 中的直方图
我们可以使用 hist() 函数在 Matplotlib 中创建直方图。此函数允许我们自定义直方图的各个方面,例如区间的数量、颜色和透明度。Matplotlib 中的直方图用于表示数值数据的分布,帮助你识别模式。
hist() 函数
Matplotlib 中的 hist() 函数以数据集作为输入,并将其划分为区间(区间)。然后,它将落在每个区间内的数据点的频率(计数)显示为条形图。
以下是 Matplotlib 中 hist() 函数的语法:
语法
plt.hist(x, bins=None, range=None, density=False, cumulative=False, color=None, edgecolor=None, ...)
其中,
x 是确定直方图的输入数据。
bins(可选) 是区间的数量或区间边缘。
range(可选) 是区间的下限和上限。默认值为 x 的最小值和最大值
如果 density(可选) 为 True,则直方图表示概率密度函数。默认为 False。
如果 cumulative(可选) 为 True,则计算累积直方图。默认为 False。
这些只是一些参数;还有更多可选参数可用于自定义。
创建垂直直方图
在 Matplotlib 中,创建垂直直方图涉及绘制数据集频率分布的图形表示,其中条形沿 y 轴垂直排列。每个条形表示沿 x 轴特定区间或区间内数据点的频率或计数。
示例
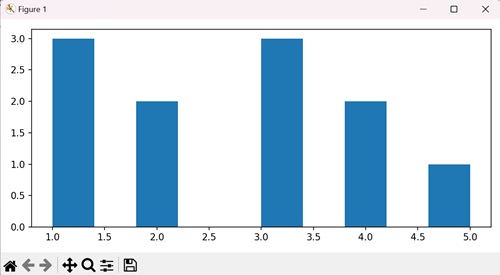
在以下示例中,我们通过在 hist() 函数中将“orientation”参数设置为“vertical”来创建垂直直方图:
import matplotlib.pyplot as plt
plt.rcParams["figure.figsize"] = [7.50, 3.50]
plt.rcParams["figure.autolayout"] = True
x = [1, 2, 3, 1, 2, 3, 4, 1, 3, 4, 5]
plt.hist(x, orientation="vertical")
plt.show()
输出
我们得到如下所示的输出:
带密度的自定义直方图
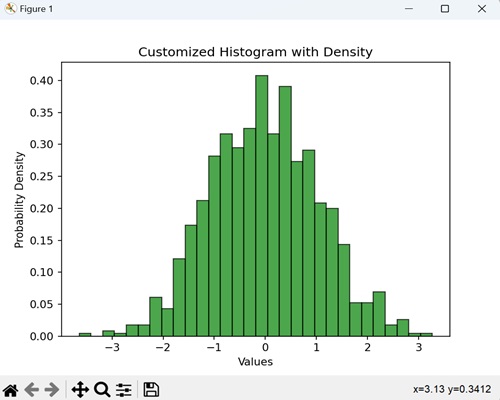
当我们使用密度创建直方图时,我们提供了数据的分布情况的视觉摘要。我们使用此图形来查看不同数字出现的可能性,而 density 选项确保直方图下方的总面积归一化为 1。
示例
在以下示例中,我们将随机数据可视化为具有 30 个区间的直方图,以绿色显示并带有黑色边缘。我们使用 density=True 参数来表示概率密度:
import matplotlib.pyplot as plt
import numpy as np

# Generate random data
data = np.random.randn(1000)

# Create a histogram with density and custom color
plt.hist(data, bins=30, density=True, color='green', edgecolor='black', alpha=0.7)
plt.xlabel('Values')
plt.ylabel('Probability Density')
plt.title('Customized Histogram with Density')
plt.show()
输出
执行上述代码后,我们将得到以下输出:
累积直方图
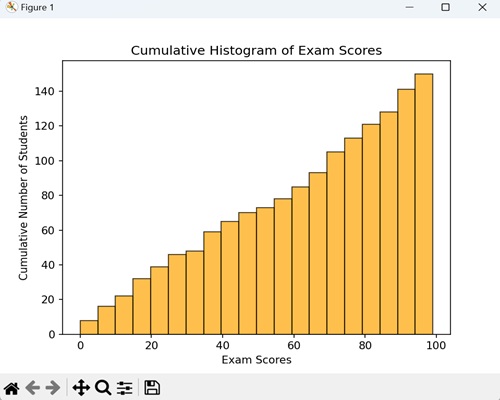
当我们创建累积直方图时,我们以图形方式表示直到某个点为止值的总出现次数。它显示了多少数据点低于或等于某个值。
示例
在这里,我们使用一个直方图,其中每个条形代表一个考试分数范围,而条形的高度告诉我们总共有多少学生获得了该范围内的分数。通过在 hist() 函数中设置 cumulative=True 参数,我们确保直方图显示分数的累积进展:
import matplotlib.pyplot as plt
import numpy as np

# Generate random exam scores (out of 100)
exam_scores = np.random.randint(0, 100, 150)

# Create a cumulative histogram
plt.hist(exam_scores, bins=20, cumulative=True, color='orange', edgecolor='black', alpha=0.7)
plt.xlabel('Exam Scores')
plt.ylabel('Cumulative Number of Students')
plt.title('Cumulative Histogram of Exam Scores')
plt.show()
输出
以下是上述代码的输出:
具有不同颜色和边缘颜色的直方图
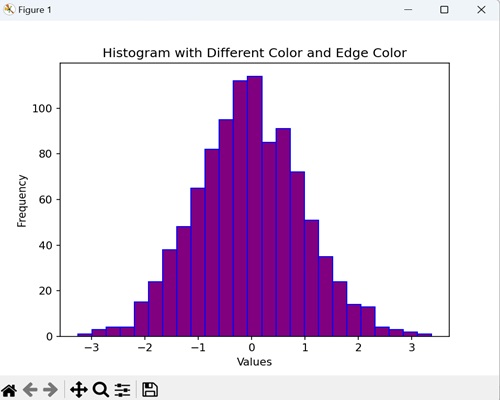
创建直方图时,我们可以自定义填充颜色和边缘颜色,为表示数据分布添加视觉效果。通过这样做,我们将直方图与时尚和独特的视觉效果融为一体。
示例
现在,我们正在为随机数据生成一个具有 25 个区间的直方图,并以紫色显示并带有蓝色边缘:
import matplotlib.pyplot as plt
import numpy as np
data = np.random.randn(1000)

# Creating a histogram with different color and edge color
plt.hist(data, bins=25, color='purple', edgecolor='blue')
plt.xlabel('Values')
plt.ylabel('Frequency')
plt.title('Histogram with Different Color and Edge Color')
plt.show()
输出
执行上述代码后,我们将得到以下输出:
示例
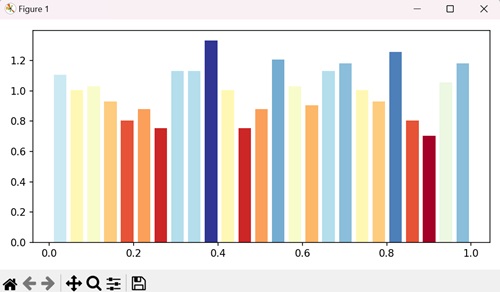
要绘制带颜色的直方图,我们还可以从 setp() 方法中的“cm”参数中提取颜色。
import numpy as np
from matplotlib import pyplot as plt
plt.rcParams["figure.figsize"] = [7.00, 3.50]
plt.rcParams["figure.autolayout"] = True
data = np.random.random(1000)
n, bins, patches = plt.hist(data, bins=25, density=True, color='red', rwidth=0.75)
col = (n-n.min())/(n.max()-n.min())
cm = plt.cm.get_cmap('RdYlBu')
for c, p in zip(col, patches):
   plt.setp(p, 'facecolor', cm(c))
plt.show()
输出
执行上述代码后,我们将得到以下输出:
示例
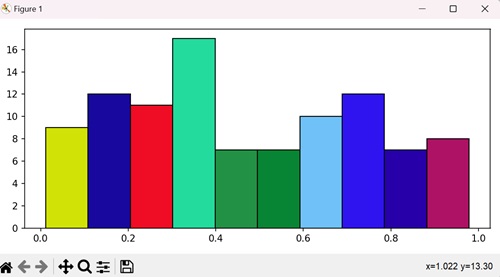
在这里,我们通过迭代区间数量的范围并为每个条形设置随机 facecolor 来为 Matplotlib 直方图中的不同条形指定不同的颜色:
import numpy as np
import matplotlib.pyplot as plt
import random
import string

# Set the figure size
plt.rcParams["figure.figsize"] = [7.50, 3.50]
plt.rcParams["figure.autolayout"] = True

# Figure and set of subplots
fig, ax = plt.subplots()

# Random data
data = np.random.rand(100)

# Plot a histogram with random data
N, bins, patches = ax.hist(data, edgecolor='black', linewidth=1)

# Random facecolor for each bar
for i in range(len(N)):
   patches[i].set_facecolor("#" + ''.join(random.choices("ABCDEF" + string.digits, k=6)))

# Display the plot
plt.show()
输出
执行上述代码后,我们将得到以下输出:
具有多个数据集的堆叠直方图
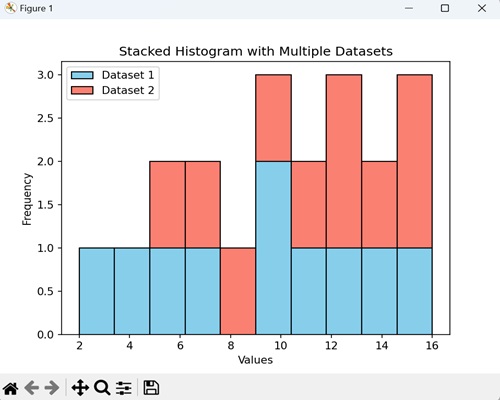
具有多个数据集的堆叠直方图是一种视觉表示,它组合了两个或多个数据集的分布。条形彼此堆叠,从而可以比较不同数据集如何影响整体分布。
示例
在下面的示例中,我们使用特定值表示两个不同的数据集“data1”和“data2”,并以不同的颜色(天蓝色和鲑鱼色)显示它们的分布:
import matplotlib.pyplot as plt
import numpy as np

# Sample data for two datasets
data1 = np.array([2, 4, 5, 7, 9, 10, 11, 13, 14, 15])
data2 = np.array([6, 7, 8, 10, 11, 12, 13, 14, 15, 16])

# Creating a stacked histogram with different colors
plt.hist([data1, data2], bins=10, stacked=True, color=['skyblue', 'salmon'], edgecolor='black')
plt.xlabel('Values')
plt.ylabel('Frequency')
plt.title('Stacked Histogram with Multiple Datasets')
plt.legend(['Dataset 1', 'Dataset 2'])
plt.show()
输出
执行上述代码后,我们将得到以下输出:
