- Matplotlib 基础
- Matplotlib - 首页
- Matplotlib - 简介
- Matplotlib - 与 Seaborn 的对比
- Matplotlib - 环境设置
- Matplotlib - Anaconda 发行版
- Matplotlib - Jupyter Notebook
- Matplotlib - Pyplot API
- Matplotlib - 简单绘图
- Matplotlib - 保存图形
- Matplotlib - 标记
- Matplotlib - 图形
- Matplotlib - 样式
- Matplotlib - 图例
- Matplotlib - 颜色
- Matplotlib - 色图
- Matplotlib - 色图归一化
- Matplotlib - 选择色图
- Matplotlib - 色标
- Matplotlib - 文本
- Matplotlib - 文本属性
- Matplotlib - 子图标题
- Matplotlib - 图像
- Matplotlib - 图像遮罩
- Matplotlib - 注释
- Matplotlib - 箭头
- Matplotlib - 字体
- Matplotlib - 什么是字体?
- 全局设置字体属性
- Matplotlib - 字体索引
- Matplotlib - 字体属性
- Matplotlib - 刻度
- Matplotlib - 线性和对数刻度
- Matplotlib - 对称对数和 Logit 刻度
- Matplotlib - LaTeX
- Matplotlib - 什么是 LaTeX?
- Matplotlib - LaTeX 用于数学表达式
- Matplotlib - LaTeX 在注释中的文本格式化
- Matplotlib - PostScript
- 在注释中启用 LaTeX 渲染
- Matplotlib - 数学表达式
- Matplotlib - 动画
- Matplotlib - 图元
- Matplotlib - 使用 Cycler 进行样式设置
- Matplotlib - 路径
- Matplotlib - 路径效果
- Matplotlib - 变换
- Matplotlib - 刻度和刻度标签
- Matplotlib - 弧度刻度
- Matplotlib - 日期刻度
- Matplotlib - 刻度格式化器
- Matplotlib - 刻度定位器
- Matplotlib - 基本单位
- Matplotlib - 自动缩放
- Matplotlib - 反转轴
- Matplotlib - 对数轴
- Matplotlib - Symlog
- Matplotlib - 单位处理
- Matplotlib - 带单位的椭圆
- Matplotlib - 脊柱
- Matplotlib - 轴范围
- Matplotlib - 轴刻度
- Matplotlib - 轴刻度
- Matplotlib - 格式化轴
- Matplotlib - Axes 类
- Matplotlib - 双轴
- Matplotlib - Figure 类
- Matplotlib - 多图
- Matplotlib - 网格
- Matplotlib - 面向对象接口
- Matplotlib - PyLab 模块
- Matplotlib - Subplots() 函数
- Matplotlib - Subplot2grid() 函数
- Matplotlib - 固定图元
- Matplotlib - 手动等值线
- Matplotlib - 坐标报告
- Matplotlib - AGG 过滤器
- Matplotlib - 带状框
- Matplotlib - 填充螺旋线
- Matplotlib - Findobj 演示
- Matplotlib - 超链接
- Matplotlib - 图像缩略图
- Matplotlib - 使用关键字绘图
- Matplotlib - 创建 Logo
- Matplotlib - 多页 PDF
- Matplotlib - 多处理
- Matplotlib - 打印标准输出
- Matplotlib - 复合路径
- Matplotlib - Sankey 类
- Matplotlib - MRI 与 EEG
- Matplotlib - 样式表
- Matplotlib - 背景颜色
- Matplotlib - Basemap
- Matplotlib 事件处理
- Matplotlib - 事件处理
- Matplotlib - 关闭事件
- Matplotlib - 鼠标移动
- Matplotlib - 点击事件
- Matplotlib - 滚动事件
- Matplotlib - 按键事件
- Matplotlib - 选择事件
- Matplotlib - 观察镜
- Matplotlib - 路径编辑器
- Matplotlib - 多边形编辑器
- Matplotlib - 定时器
- Matplotlib - Viewlims
- Matplotlib - 缩放窗口
- Matplotlib 小部件
- Matplotlib - 光标小部件
- Matplotlib - 带注释的光标
- Matplotlib - 按钮小部件
- Matplotlib - 复选框
- Matplotlib - 套索选择器
- Matplotlib - 菜单小部件
- Matplotlib - 鼠标光标
- Matplotlib - 多光标
- Matplotlib - 多边形选择器
- Matplotlib - 单选按钮
- Matplotlib - 范围滑块
- Matplotlib - 矩形选择器
- Matplotlib - 椭圆选择器
- Matplotlib - 滑块小部件
- Matplotlib - 跨度选择器
- Matplotlib - 文本框
- Matplotlib 绘图
- Matplotlib - 条形图
- Matplotlib - 直方图
- Matplotlib - 饼图
- Matplotlib - 散点图
- Matplotlib - 箱线图
- Matplotlib - 小提琴图
- Matplotlib - 等值线图
- Matplotlib - 3D 绘图
- Matplotlib - 3D 等值线
- Matplotlib - 3D 线框图
- Matplotlib - 3D 表面图
- Matplotlib - Quiver 图
- Matplotlib 有用资源
- Matplotlib - 快速指南
- Matplotlib - 有用资源
- Matplotlib - 讨论
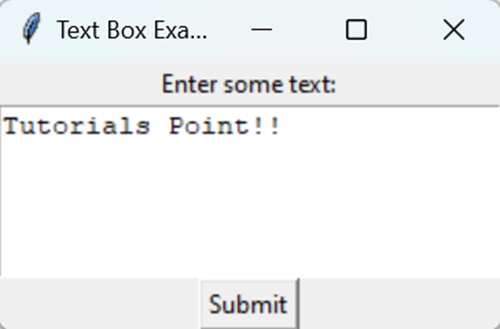
Matplotlib - 文本框
文本框是文档或屏幕上可以键入或显示文本的区域。它就像一个小盒子,您可以在其中输入或输出单词、句子或段落。可以这样理解:
输入文本框 - 当您在表单或网站上看到一个空白区域,可以在其中键入您的姓名、电子邮件或任何其他信息时,那就是一个文本框。您可以点击它并开始键入。
输出文本框 - 当您在网页或文档的某个部分看到显示文本时,例如消息或描述,那也是一个文本框。它只是显示文本,而不是允许您在其中键入。
Matplotlib 中的文本框
在 Matplotlib 中,文本框是一个图形元素,用于在绘图中显示文本,提供其他信息或注释。它允许您直接在绘图上包含描述性文本、标签或解释。
您可以使用 text() 函数在 Matplotlib 中创建文本框。在 Matplotlib 中,用于创建文本框的函数是 plt.text()。此函数允许您将文本直接添加到绘图中,指定文本内容及其在绘图中的位置。此外,您可以自定义文本框的各种属性,例如字体样式、大小、颜色、对齐方式和背景颜色,以满足其可视化需求。
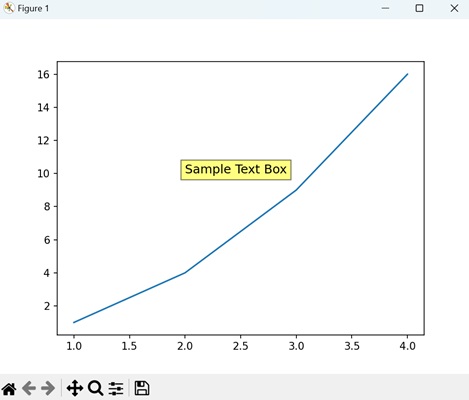
基本文本框
Matplotlib 中的基本文本框是在绘图中添加文本的一种简单方法。它允许您将标签或注释直接添加到绘图上。您可以使用 text() 函数指定文本的内容及其在绘图中的位置。
示例
在下面的示例中,我们正在创建一个基本文本框,文本为“Sample Text Box”,位于绘图上的 (2, 10) 坐标处:
import matplotlib.pyplot as plt

# Creating a plot
plt.plot([1, 2, 3, 4], [1, 4, 9, 16])

# Adding a basic text box
plt.text(2, 10, 'Sample Text Box', fontsize=12, bbox=dict(facecolor='yellow', alpha=0.5))

# Displaying the plot
plt.show()
输出
以下是上述代码的输出:
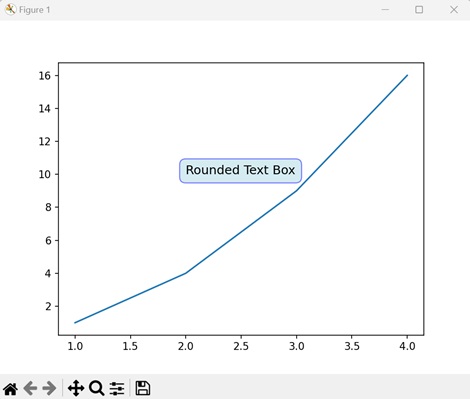
圆角文本框
Matplotlib 中的圆角文本框是基本文本框的一种变体,具有圆角。它允许您在矩形框内向绘图添加文本,但具有圆滑的角。
示例
在这里,我们正在创建一个圆角文本框,文本为“Rounded Text Box”,位于绘图上的 (2, 10) 坐标处:
import matplotlib.pyplot as plt

# Creating a plot
plt.plot([1, 2, 3, 4], [1, 4, 9, 16])

# Adding a rounded text box
plt.text(2, 10, 'Rounded Text Box', fontsize=12, bbox=dict(facecolor='lightblue', alpha=0.5, edgecolor='blue', boxstyle='round,pad=0.5'))

# Displaying the plot
plt.show()
输出
执行上述代码后,我们将得到以下输出:
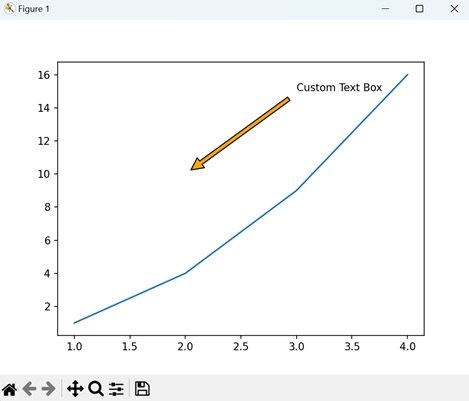
带箭头的自定义文本框
Matplotlib 中带箭头的自定义文本框是一种特殊的注释类型,它将文本框与指向绘图上特定位置的箭头结合起来。这是一种在绘图中引起对特定特征或数据点的注意的方法。
示例
以下示例创建一个带箭头的自定义文本框,指向绘图上 (2, 10) 坐标处的“Custom Text Box”文本:
import matplotlib.pyplot as plt

# Creating a plot
plt.plot([1, 2, 3, 4], [1, 4, 9, 16])

# Adding a custom text box with arrow
plt.annotate('Custom Text Box', xy=(2, 10), xytext=(3, 15),
   arrowprops=dict(facecolor='orange', shrink=0.05))

# Displaying the plot
plt.show()
输出
执行上述代码后,我们将得到以下输出:
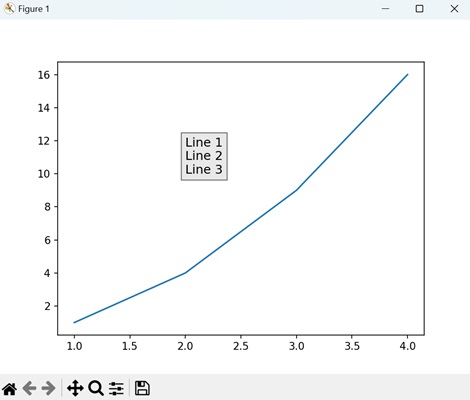
多行文本框
在 Matplotlib 中,多行文本框允许您在绘图上的单个注释框中包含多行文本。此功能对于添加跨越多行的较长解释、描述或标签很有用。
示例
现在,我们正在创建一个多行文本框,其中包含三行文本,位于绘图上的 (2, 10) 坐标处。我们用“\n”分隔每一行:
import matplotlib.pyplot as plt

# Creating a plot
plt.plot([1, 2, 3, 4], [1, 4, 9, 16])

# Adding a multiline text box
plt.text(2, 10, 'Line 1\nLine 2\nLine 3', fontsize=12, bbox=dict(facecolor='lightgrey', alpha=0.5))

# Displaying the plot
plt.show()
输出
执行上述代码后,我们将得到以下输出: