- Matplotlib 基础
- Matplotlib - 首页
- Matplotlib - 简介
- Matplotlib - 与 Seaborn 的比较
- Matplotlib - 环境搭建
- Matplotlib - Anaconda 发行版
- Matplotlib - Jupyter Notebook
- Matplotlib - Pyplot API
- Matplotlib - 简单绘图
- Matplotlib - 保存图表
- Matplotlib - 标记
- Matplotlib - 图表
- Matplotlib - 样式
- Matplotlib - 图例
- Matplotlib - 颜色
- Matplotlib - 颜色图
- Matplotlib - 颜色图归一化
- Matplotlib - 选择颜色图
- Matplotlib - 颜色条
- Matplotlib - 文本
- Matplotlib - 文本属性
- Matplotlib - 子图标题
- Matplotlib - 图片
- Matplotlib - 图片蒙版
- Matplotlib - 注释
- Matplotlib - 箭头
- Matplotlib - 字体
- Matplotlib - 什么是字体?
- 全局设置字体属性
- Matplotlib - 字体索引
- Matplotlib - 字体属性
- Matplotlib - 比例尺
- Matplotlib - 线性和对数比例尺
- Matplotlib - 对称对数和 Logit 比例尺
- Matplotlib - LaTeX
- Matplotlib - 什么是 LaTeX?
- Matplotlib - 用于数学表达式的 LaTeX
- Matplotlib - 注释中的 LaTeX 文本格式
- Matplotlib - PostScript
- 在注释中启用 LaTeX 渲染
- Matplotlib - 数学表达式
- Matplotlib - 动画
- Matplotlib - 图形元素
- Matplotlib - 使用 Cycler 进行样式设置
- Matplotlib - 路径
- Matplotlib - 路径效果
- Matplotlib - 坐标变换
- Matplotlib - 刻度和刻度标签
- Matplotlib - 弧度刻度
- Matplotlib - 日期刻度
- Matplotlib - 刻度格式化器
- Matplotlib - 刻度定位器
- Matplotlib - 基本单位
- Matplotlib - 自动缩放
- Matplotlib - 反转坐标轴
- Matplotlib - 对数坐标轴
- Matplotlib - Symlog
- Matplotlib - 单位处理
- Matplotlib - 带单位的椭圆
- Matplotlib - 脊柱
- Matplotlib - 坐标轴范围
- Matplotlib - 坐标轴比例尺
- Matplotlib - 坐标轴刻度
- Matplotlib - 坐标轴格式化
- Matplotlib - Axes 类
- Matplotlib - 双坐标轴
- Matplotlib - Figure 类
- Matplotlib - 多图
- Matplotlib - 网格
- Matplotlib - 面向对象接口
- Matplotlib - PyLab 模块
- Matplotlib - subplots() 函数
- Matplotlib - subplot2grid() 函数
- Matplotlib - 固定位置的图形元素
- Matplotlib - 手动等值线
- Matplotlib - 坐标报告
- Matplotlib - AGG 过滤器
- Matplotlib - 带状盒
- Matplotlib - 填充螺旋线
- Matplotlib - findobj 演示
- Matplotlib - 超链接
- Matplotlib - 图片缩略图
- Matplotlib - 使用关键字绘图
- Matplotlib - 创建 Logo
- Matplotlib - 多页 PDF
- Matplotlib - 多进程
- Matplotlib - 打印标准输出
- Matplotlib - 复合路径
- Matplotlib - Sankey 类
- Matplotlib - MRI 与 EEG
- Matplotlib - 样式表
- Matplotlib - 背景颜色
- Matplotlib - Basemap
- Matplotlib 事件处理
- Matplotlib - 事件处理
- Matplotlib - 关闭事件
- Matplotlib - 鼠标移动
- Matplotlib - 点击事件
- Matplotlib - 滚动事件
- Matplotlib - 按键事件
- Matplotlib - 选择事件
- Matplotlib - 透镜
- Matplotlib - 路径编辑器
- Matplotlib - 多边形编辑器
- Matplotlib - 定时器
- Matplotlib - viewlims
- Matplotlib - 缩放窗口
- Matplotlib 小部件
- Matplotlib - 光标小部件
- Matplotlib - 带注释的光标
- Matplotlib - 按钮小部件
- Matplotlib - 复选框
- Matplotlib - 套索选择器
- Matplotlib - 菜单小部件
- Matplotlib - 鼠标光标
- Matplotlib - 多光标
- Matplotlib - 多边形选择器
- Matplotlib - 单选按钮
- Matplotlib - RangeSlider
- Matplotlib - 矩形选择器
- Matplotlib - 椭圆选择器
- Matplotlib - 滑块小部件
- Matplotlib - Span Selector
- Matplotlib - 文本框
- Matplotlib 绘图
- Matplotlib - 条形图
- Matplotlib - 直方图
- Matplotlib - 饼图
- Matplotlib - 散点图
- Matplotlib - 箱线图
- Matplotlib - 小提琴图
- Matplotlib - 等高线图
- Matplotlib - 3D 绘图
- Matplotlib - 3D 等高线
- Matplotlib - 3D 线框图
- Matplotlib - 3D 表面图
- Matplotlib - 矢羽图
- Matplotlib 有用资源
- Matplotlib - 快速指南
- Matplotlib - 有用资源
- Matplotlib - 讨论
Matplotlib - 图片
Matplotlib 中的图片是什么?
在 Matplotlib 库中,显示和操作图片涉及使用imshow()函数。此函数可视化二维数组或图片。此函数对于显示各种格式的图片特别有用,例如表示像素值的数组或实际的图片文件。
Matplotlib 中的图片提供了一种可视化网格数据的方法,方便解释和分析以二维数组表示的信息。此功能对于处理图像数据的各种科学、工程和机器学习应用至关重要。
Matplotlib 中图片的用例
以下是 Matplotlib 库中图片的用例。
可视化网格数据
matplotlib 库可用于显示科学数据,例如热图、地形图、卫星图像等。
图像处理
在计算机视觉或图像识别等应用中分析和操作图像数据。
人工智能和机器学习
在模型的训练和评估中处理和处理图像数据。
加载和显示图片
要使用 Matplotlib 库加载和显示图片,我们可以使用以下几行代码。
示例
import matplotlib.pyplot as plt
import matplotlib.image as mpimg

# Load the image
img = mpimg.imread('Images/flowers.jpg')  # Load image file

# Display the image
plt.imshow(img)
plt.axis('off')  # Turn off axis labels and ticks (optional)
plt.show()
上述代码的关键点
matplotlib.image.imread() − 加载图片文件并将其作为数组返回。应指定文件路径 ('image_path')。
plt.imshow() − 显示由数组表示的图片。
plt.axis('off') − 关闭坐标轴标签和刻度,对于仅显示图片而不显示坐标轴是可选的。
输出

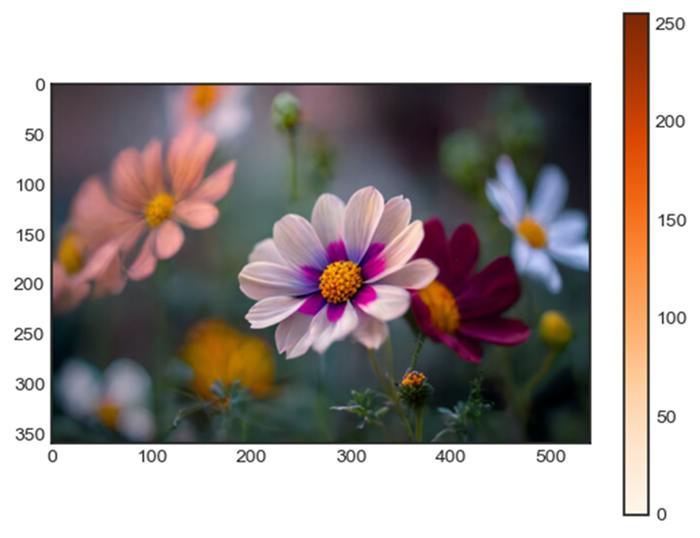
自定义图片显示
我们可以根据需要通过以下提到的函数自定义图片。
颜色图 − 我们可以通过在imshow()中指定cmap参数来应用颜色图以增强图片可视化效果。
颜色条 − 若要添加一个指示强度映射的颜色条,可以在imshow()之后使用plt.colorbar()。
示例
import matplotlib.pyplot as plt
import matplotlib.image as mpimg

# Load the image
img = mpimg.imread('Images/flowers.jpg')  # Load image file

# Display the image
plt.imshow(img, cmap = 'Oranges')
plt.colorbar()

# Turn on axis labels and ticks (optional)
plt.axis('on')
plt.show()
输出
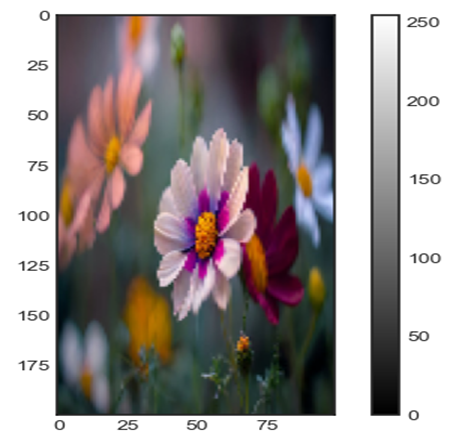
图片处理
我们可以使用以下提到的函数对图片进行处理。
裁剪 − 通过在将其传递给imshow()之前切片数组来选择图片的特定部分。
调整大小 − 使用 Pillow、OpenCV 等各种图像处理库在显示图片之前调整图片大小。
示例
在这个例子中,我们正在操作图片,并使用上述函数显示图片。
import matplotlib.pyplot as plt
import matplotlib.image as mpimg
import cv2

# Load the image
img = mpimg.imread('Images/flowers.jpg')

# Display the image with grayscale colormap and colorbar
plt.imshow(img, cmap='gray')
plt.colorbar()

# Display only a portion of the image (cropping)
plt.imshow(img[100:300, 200:400])

# Display a resized version of the image
resized_img = cv2.resize(img, (new_width, new_height))
plt.imshow(resized_img)
plt.show()
输出
请记住,Matplotlib 的imshow()适用于基本的图片显示和可视化。对于更高级的图像处理任务,例如调整大小、过滤等,建议使用 OpenCV 或 Pillow 等专用图像处理库。