- Matplotlib 基础
- Matplotlib - 首页
- Matplotlib - 简介
- Matplotlib - 与 Seaborn 的对比
- Matplotlib - 环境设置
- Matplotlib - Anaconda 发行版
- Matplotlib - Jupyter Notebook
- Matplotlib - Pyplot API
- Matplotlib - 简单绘图
- Matplotlib - 保存图形
- Matplotlib - 标记
- Matplotlib - 图形
- Matplotlib - 样式
- Matplotlib - 图例
- Matplotlib - 颜色
- Matplotlib - 颜色映射
- Matplotlib - 颜色映射归一化
- Matplotlib - 选择颜色映射
- Matplotlib - 色标
- Matplotlib - 文本
- Matplotlib - 文本属性
- Matplotlib - 子图标题
- Matplotlib - 图像
- Matplotlib - 图像蒙版
- Matplotlib - 注释
- Matplotlib - 箭头
- Matplotlib - 字体
- Matplotlib - 什么是字体?
- 全局设置字体属性
- Matplotlib - 字体索引
- Matplotlib - 字体属性
- Matplotlib - 刻度
- Matplotlib - 线性和对数刻度
- Matplotlib - 对称对数和 Logit 刻度
- Matplotlib - LaTeX
- Matplotlib - 什么是 LaTeX?
- Matplotlib - LaTeX 用于数学表达式
- Matplotlib - 在注释中使用 LaTeX 进行文本格式化
- Matplotlib - PostScript
- 在注释中启用 LaTeX 渲染
- Matplotlib - 数学表达式
- Matplotlib - 动画
- Matplotlib - 图形对象
- Matplotlib - 使用 Cycler 进行样式设置
- Matplotlib - 路径
- Matplotlib - 路径效果
- Matplotlib - 转换
- Matplotlib - 刻度和刻度标签
- Matplotlib - 弧度刻度
- Matplotlib - 日期刻度
- Matplotlib - 刻度格式化器
- Matplotlib - 刻度定位器
- Matplotlib - 基本单位
- Matplotlib - 自动缩放
- Matplotlib - 反转坐标轴
- Matplotlib - 对数坐标轴
- Matplotlib - Symlog
- Matplotlib - 单位处理
- Matplotlib - 带有单位的椭圆
- Matplotlib - 脊柱
- Matplotlib - 坐标轴范围
- Matplotlib - 坐标轴刻度
- Matplotlib - 坐标轴刻度
- Matplotlib - 格式化坐标轴
- Matplotlib - Axes 类
- Matplotlib - 双坐标轴
- Matplotlib - Figure 类
- Matplotlib - 多图
- Matplotlib - 网格
- Matplotlib - 面向对象接口
- Matplotlib - PyLab 模块
- Matplotlib - Subplots() 函数
- Matplotlib - Subplot2grid() 函数
- Matplotlib - 固定图形对象
- Matplotlib - 手动等值线
- Matplotlib - 坐标报告
- Matplotlib - AGG 过滤器
- Matplotlib - 带状框
- Matplotlib - 填充螺旋线
- Matplotlib - Findobj 演示
- Matplotlib - 超链接
- Matplotlib - 图像缩略图
- Matplotlib - 使用关键字绘图
- Matplotlib - 创建 Logo
- Matplotlib - 多页 PDF
- Matplotlib - 多进程
- Matplotlib - 打印标准输出
- Matplotlib - 复合路径
- Matplotlib - Sankey 类
- Matplotlib - MRI 与 EEG
- Matplotlib - 样式表
- Matplotlib - 背景颜色
- Matplotlib - Basemap
- Matplotlib 事件处理
- Matplotlib - 事件处理
- Matplotlib - 关闭事件
- Matplotlib - 鼠标移动
- Matplotlib - 点击事件
- Matplotlib - 滚动事件
- Matplotlib - 按键事件
- Matplotlib - 选择事件
- Matplotlib - 放大镜
- Matplotlib - 路径编辑器
- Matplotlib - 多边形编辑器
- Matplotlib - 定时器
- Matplotlib - Viewlims
- Matplotlib - 缩放窗口
- Matplotlib 小部件
- Matplotlib - 游标小部件
- Matplotlib - 带注释的游标
- Matplotlib - 按钮小部件
- Matplotlib - 复选框
- Matplotlib - 套索选择器
- Matplotlib - 菜单小部件
- Matplotlib - 鼠标游标
- Matplotlib - 多游标
- Matplotlib - 多边形选择器
- Matplotlib - 单选按钮
- Matplotlib - 范围滑块
- Matplotlib - 矩形选择器
- Matplotlib - 椭圆选择器
- Matplotlib - 滑块小部件
- Matplotlib - 跨度选择器
- Matplotlib - 文本框
- Matplotlib 绘图
- Matplotlib - 条形图
- Matplotlib - 直方图
- Matplotlib - 饼图
- Matplotlib - 散点图
- Matplotlib - 箱线图
- Matplotlib - 小提琴图
- Matplotlib - 等值线图
- Matplotlib - 3D 绘图
- Matplotlib - 3D 等值线
- Matplotlib - 3D 线框图
- Matplotlib - 3D 曲面图
- Matplotlib - Quiver 图
- Matplotlib 有用资源
- Matplotlib - 快速指南
- Matplotlib - 有用资源
- Matplotlib - 讨论
Matplotlib - 在注释中启用 LaTeX 渲染
什么是 LaTeX 渲染?
LaTeX 渲染是指将包含排版指令和命令的 LaTeX 标记语言转换为格式化输出的过程。此输出通常是高质量的文档、数学公式、科学论文或技术报告,具有精确且一致的排版。
由于其强大的排版功能以及生成专业外观文档的能力,LaTeX 渲染广泛应用于学术界、科学研究、技术文档和出版领域。
LaTeX 渲染的关键方面
排版 - LaTeX 以其卓越的排版功能而闻名,可确保学术和技术内容的专业级文档格式。
数学公式 - LaTeX 因其在排版复杂数学方程式方面的出色支持而被广泛使用,使其成为学术和科学出版物的首选。
标记语言 - LaTeX 使用标记语言,用户使用纯文本编写文档,并包含命令以指定格式、结构和内容。
编译 - LaTeX 源代码需要使用 LaTeX 编译器(如 pdflatex、xelatex、lualatex)进行编译。在编译过程中,编译器会解释 LaTeX 命令并生成各种格式的最终输出,例如 PDF、DVI 或 PostScript。
自定义 - LaTeX 允许用户创建自定义样式、模板和包,从而能够精确控制文档格式和布局。
LaTeX 渲染的优势
质量和一致性 - LaTeX 确保在各种平台和设备上具有高质量且一致的文档格式。
数学排版 - 它擅长处理复杂的数学符号,使其成为科学和数学内容必不可少的工具。
跨平台兼容性 - LaTeX 文档可以轻松地在不同的操作系统上编译和查看。
版本控制 - 基于纯文本的源文件通过简化协作和文档历史管理来促进版本控制系统。
启用 Latex 渲染
要启用 LaTeX 渲染以创建文档、方程式或注释,我们通常需要以下内容。
LaTeX 安装
安装 LaTeX 发行版(如 TeX Live、MiKTeX 或 MacTeX),其中包含必要的 LaTeX 编译器和包。
文本编辑器
选择一个支持 LaTeX 的文本编辑器或集成开发环境 (IDE),例如 TeXstudio、TeXworks、Overleaf 或像 Sublime Text、VS Code 或 Atom 这样的编辑器,并使用 LaTeX 插件/扩展。
编写 LaTeX 代码
创建一个 .tex 文件,并使用适当的命令和语法编写 LaTeX 代码来构建我们的文档,其中包括方程式或格式化文本。
编译
使用 LaTeX 编译器将 .tex 文件编译成所需的输出格式,例如 PDF、DVI、PS。在终端中运行相应的命令,或使用我们选择的编辑器/IDE 的集成功能。
例如,在终端中,我们可能会运行以下代码。
示例
pdflatex your_file.tex
或者在编辑器/IDE 中,通常有一个 构建 或 编译 按钮来启动编译过程。
Matplotlib 中用于注释的 LaTeX 渲染
对于 Matplotlib 注释,在绘图中使用 LaTeX 进行文本格式化,我们必须确保以下几点。
Matplotlib 支持 - Matplotlib 通过在 plt.annotate() 或类似函数中使用 LaTeX 语法来支持 LaTeX 注释。
LaTeX 安装 - 确保我们的系统上安装了可供 Matplotlib 访问的正常工作的 LaTeX 安装,以便在注释中渲染 LaTeX 文本。
正确的语法 - 在 Matplotlib 函数中使用正确的 LaTeX 语法 r'$...$' 进行注释,以渲染所需的 LaTeX 格式化文本。
通过遵循上述步骤,我们可以启用 LaTeX 渲染以用于各种目的,例如文档创建、数学符号或可视化库(如 Matplotlib)中的注释。
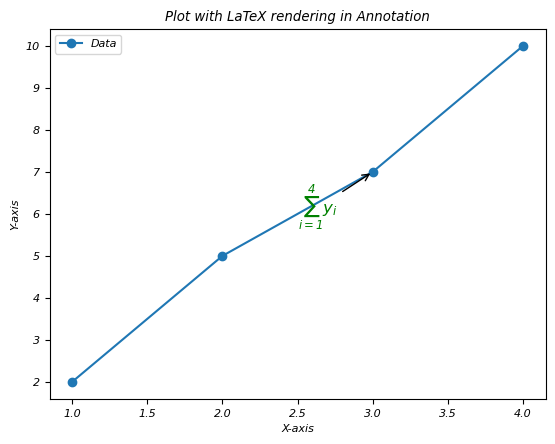
启用 LaTeX 渲染
在这个例子中,我们将在绘图的注释中使用 LaTeX 渲染。
示例
import matplotlib.pyplot as plt
# Sample data
x = [1, 2, 3, 4]
y = [2, 5, 7, 10]
plt.plot(x, y, 'o-', label='Data')
# Annotating a point with LaTeX-rendered text
plt.annotate(r'$\sum_{i=1}^{4} y_i$',   # LaTeX expression within the annotation
   xy=(x[2], y[2]),           # Coordinates of the annotation point
   xytext=(2.5, 6),           # Text position
   arrowprops=dict(facecolor='black', arrowstyle='->'),
   fontsize=12,
   color='green')
# Labeling axes and title
plt.xlabel('X-axis')
plt.ylabel('Y-axis')
plt.title('Plot with LaTeX rendering in Annotation')
plt.legend()
plt.show()
输出
执行上述代码后,您将获得以下输出 -
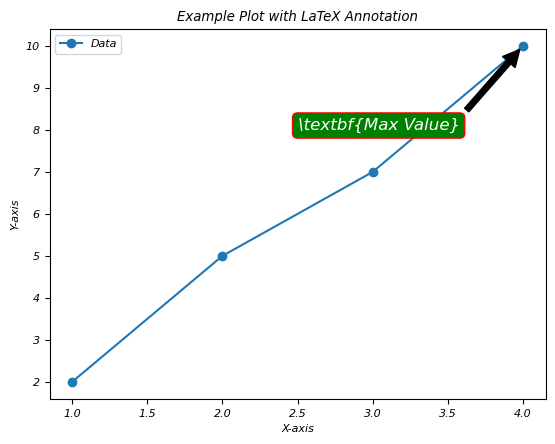
示例
这里这是另一个在绘图注释中使用 LaTeX 渲染的示例。
import matplotlib.pyplot as plt
# Generating some data points
x = [1, 2, 3, 4]
y = [2, 5, 7, 10]
plt.plot(x, y, 'o-', label='Data')
# Annotating a point with LaTeX rendering
plt.annotate(r'\textbf{Max Value}',
   xy=(x[y.index(max(y))], max(y)),
   xytext=(2.5, 8),
   arrowprops=dict(facecolor='black', shrink=0.05),
   fontsize=12,
   color='white',
   bbox=dict(boxstyle='round,pad=0.3', edgecolor='red', facecolor='green'))
plt.xlabel('X-axis')
plt.ylabel('Y-axis')
plt.title('Example Plot with LaTeX Annotation')
plt.legend()
plt.show()
输出
执行上述代码后,您将获得以下输出 -
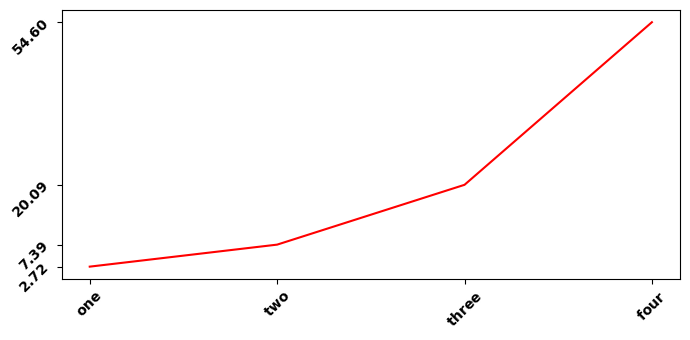
在使用 LaTeX 渲染时更改 Matplotlib 绘图中的轴刻度字体
这里这是在使用 LaTeX 渲染时更改 matplotlib 中轴刻度字体的示例
示例
import numpy as np
import matplotlib.pyplot as plt
plt.rcParams["figure.figsize"] = [7.00, 3.50]
plt.rcParams["figure.autolayout"] = True
x = np.array([1, 2, 3, 4])
y = np.exp(x)
ax1 = plt.subplot()
ax1.set_xticks(x)
ax1.set_yticks(y)
ax1.plot(x, y, c="red")
ax1.set_xticklabels([r"$\bf{one}$", r"$\bf{two}$", r"$\bf{three}$", r"$\bf{four}$"], rotation=45)
ax1.set_yticklabels([r"$\bf{:.2f}$".format(y[0]), r"$\bf{:.2f}$".format(y[1]),
   r"$\bf{:.2f}$".format(y[2]), r"$\bf{:.2f}$".format(y[3])], rotation=45)
plt.tight_layout()
plt.show()
输出
执行上述代码后,您将获得以下输出 -