
- Matplotlib 基础
- Matplotlib - 首页
- Matplotlib - 简介
- Matplotlib - 与 Seaborn 的比较
- Matplotlib - 环境设置
- Matplotlib - Anaconda 发行版
- Matplotlib - Jupyter Notebook
- Matplotlib - Pyplot API
- Matplotlib - 简单绘图
- Matplotlib - 保存图形
- Matplotlib - 标记
- Matplotlib - 图形
- Matplotlib - 样式
- Matplotlib - 图例
- Matplotlib - 颜色
- Matplotlib - 色图
- Matplotlib - 色图归一化
- Matplotlib - 选择色图
- Matplotlib - 色条
- Matplotlib - 文本
- Matplotlib - 文本属性
- Matplotlib - 子图标题
- Matplotlib - 图像
- Matplotlib - 图像蒙版
- Matplotlib - 注释
- Matplotlib - 箭头
- Matplotlib - 字体
- Matplotlib - 什么是字体?
- 全局设置字体属性
- Matplotlib - 字体索引
- Matplotlib - 字体属性
- Matplotlib - 刻度
- Matplotlib - 线性与对数刻度
- Matplotlib - 对称对数与 Logit 刻度
- Matplotlib - LaTeX
- Matplotlib - 什么是 LaTeX?
- Matplotlib - LaTeX 用于数学表达式
- Matplotlib - 在注释中使用 LaTeX 格式化文本
- Matplotlib - PostScript
- 在注释中启用 LaTeX 渲染
- Matplotlib - 数学表达式
- Matplotlib - 动画
- Matplotlib - 艺术家
- Matplotlib - 使用 Cycler 进行样式设置
- Matplotlib - 路径
- Matplotlib - 路径效果
- Matplotlib - 变换
- Matplotlib - 刻度和刻度标签
- Matplotlib - 弧度刻度
- Matplotlib - 日期刻度
- Matplotlib - 刻度格式化器
- Matplotlib - 刻度定位器
- Matplotlib - 基本单位
- Matplotlib - 自动缩放
- Matplotlib - 反转轴
- Matplotlib - 对数轴
- Matplotlib - Symlog
- Matplotlib - 单位处理
- Matplotlib - 带单位的椭圆
- Matplotlib - 脊柱
- Matplotlib - 轴范围
- Matplotlib - 轴刻度
- Matplotlib - 轴刻度
- Matplotlib - 格式化轴
- Matplotlib - Axes 类
- Matplotlib - 双轴
- Matplotlib - Figure 类
- Matplotlib - 多图
- Matplotlib - 网格
- Matplotlib - 面向对象接口
- Matplotlib - PyLab 模块
- Matplotlib - Subplots() 函数
- Matplotlib - Subplot2grid() 函数
- Matplotlib - 固定艺术家
- Matplotlib - 手动等值线
- Matplotlib - 坐标报告
- Matplotlib - AGG 过滤器
- Matplotlib - 飘带框
- Matplotlib - 填充螺旋
- Matplotlib - Findobj 演示
- Matplotlib - 超链接
- Matplotlib - 图像缩略图
- Matplotlib - 使用关键字绘图
- Matplotlib - 创建徽标
- Matplotlib - 多页 PDF
- Matplotlib - 多处理
- Matplotlib - 打印标准输出
- Matplotlib - 复合路径
- Matplotlib - Sankey 类
- Matplotlib - MRI 与 EEG
- Matplotlib - 样式表
- Matplotlib - 背景颜色
- Matplotlib - Basemap
- Matplotlib 事件处理
- Matplotlib - 事件处理
- Matplotlib - 关闭事件
- Matplotlib - 鼠标移动
- Matplotlib - 点击事件
- Matplotlib - 滚动事件
- Matplotlib - 按键事件
- Matplotlib - 选择事件
- Matplotlib - 观景镜
- Matplotlib - 路径编辑器
- Matplotlib - 多边形编辑器
- Matplotlib - 定时器
- Matplotlib - Viewlims
- Matplotlib - 缩放窗口
- Matplotlib 小部件
- Matplotlib - 光标小部件
- Matplotlib - 带注释的光标
- Matplotlib - 按钮小部件
- Matplotlib - 复选框
- Matplotlib - 套索选择器
- Matplotlib - 菜单小部件
- Matplotlib - 鼠标光标
- Matplotlib - 多光标
- Matplotlib - 多边形选择器
- Matplotlib - 单选按钮
- Matplotlib - 范围滑块
- Matplotlib - 矩形选择器
- Matplotlib - 椭圆选择器
- Matplotlib - 滑块小部件
- Matplotlib - 跨度选择器
- Matplotlib - 文本框
- Matplotlib 绘图
- Matplotlib - 条形图
- Matplotlib - 直方图
- Matplotlib - 饼图
- Matplotlib - 散点图
- Matplotlib - 箱线图
- Matplotlib - 小提琴图
- Matplotlib - 等值线图
- Matplotlib - 3D 绘图
- Matplotlib - 3D 等值线
- Matplotlib - 3D 线框图
- Matplotlib - 3D 表面图
- Matplotlib - 羽毛图
- Matplotlib 有用资源
- Matplotlib - 快速指南
- Matplotlib - 有用资源
- Matplotlib - 讨论
Matplotlib - 在注释中使用 LaTeX 格式化文本
什么是 LaTeX 中的文本格式化?
在 LaTeX 中,图形或绘图(例如使用 Matplotlib 库创建的图形或绘图)中的注释中的文本格式化可以通过在注释文本中使用 LaTeX 命令的子集来实现。注释有助于向图形中的元素添加解释性标签、描述或注释。
在使用像 Matplotlib 这样的支持在注释中使用 LaTeX 进行文本渲染的工具时,我们可以使用 LaTeX 命令的一个子集来格式化这些注释中的文本。这允许在注释中包含样式化的文本、数学表达式和特殊格式。
注释中的 LaTeX 格式化包括
以下是注释中的 LaTeX 格式化。让我们逐一看看。
数学表达式 - 数学表达式以分数、希腊字母、上标和下标的形式给出,使用 LaTeX 数学模式。
文本样式 - 文本样式包括粗体、斜体、下划线或使用 LaTeX 命令(如 \textbf{}、\textit{}、\underline{} 和字体大小命令)的不同字体大小。
特殊字符 - 使用 LaTeX 转义序列转义特殊字符,如美元符号、百分号或下划线。
对齐 - 对对齐的控制,尽管有限,但使用
\begin{flushleft}...\end{flushleft},
\begin{center}...\end{center},
\begin{flushright}...\end{flushright}.
在上面,我们已经了解了 LaTeX 中可用的不同样式格式,现在让我们看看使用 LaTeX 在注释中进行文本格式化。
注释中的 LaTeX 文本格式化
以下是使用 LaTeX 在注释中进行各种文本格式化。
基本文本格式化
可以在注释中使用 LaTeX 命令进行基本文本格式化。以下是一些。
粗体 - 使文本变为粗体
\textbf{Bold Text}
斜体 - 使文本变为斜体
\textit{Italic Text}
下划线 - 在文本下添加下划线
\underline{Underlined Text}
字体大小 - LaTeX 提供不同的字体大小命令,例如 \tiny、\small、\large、\Large、\huge、\Huge
使用 LaTeX 进行粗体文本注释
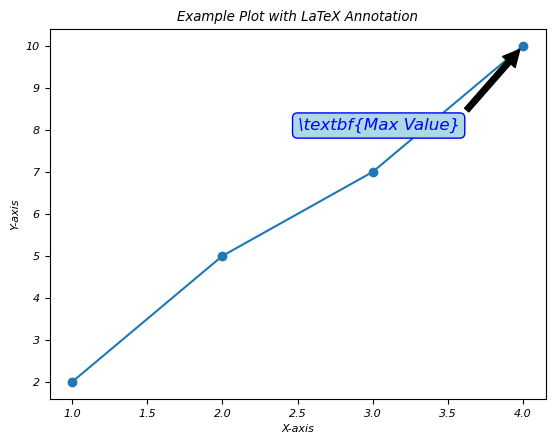
在此示例中,我们在注释中使用 LaTeX 文本格式化,使文本在绘图上看起来变为粗体。
示例
import matplotlib.pyplot as plt
# Create a simple plot
x = [1, 2, 3, 4]
y = [2, 5, 7, 10]
plt.plot(x, y, marker='o', linestyle='-')
# Add an annotation with LaTeX text formatting
plt.annotate(r'\textbf{Max Value}',
   xy=(x[y.index(max(y))], max(y)),
   xytext=(2.5, 8),
   arrowprops=dict(facecolor='black', shrink=0.05),
   fontsize=12,
   color='blue',
   bbox=dict(boxstyle='round,pad=0.3', edgecolor='blue', facecolor='lightblue'))
# Set axis labels and title
plt.xlabel('X-axis')
plt.ylabel('Y-axis')
plt.title('Example Plot with LaTeX Annotation')
# Show the plot
plt.show()
输出
执行上述代码后,您将获得以下输出:
数学符号
在 LaTeX 中,数学符号内的文本格式化涉及在数学模式中使用命令和语法来设置文本元素的样式,同时表达数学内容。它允许在数学表达式或方程式中集成文本格式化功能。
数学符号内的基本文本格式化
数学符号内的基本文本格式化如下。
粗体文本
此文本格式化将包含的文本在数学表达式中以粗体显示。
\mathbf{Bold Text}
斜体文本
斜体文本以斜体显示包含的文本在数学表达式中。
\textit{Italic Text}
无衬线文本
这将在数学模式中以无衬线字体样式呈现包含的文本。
\textsf{Sans-serif Text}
打字机文本
这在数学模式中以打字机或等宽字体显示包含的文本。
\texttt{Typewriter Text}
需要记住的重要事项
- 可以在数学模式中使用 \text{} 或特定格式化命令在数学符号内实现文本格式化。
- 某些格式化命令可能不适用于所有数学环境,或者可能需要其他包或配置。
- LaTeX 提供各种文本格式化选项,可以应用于数学表达式中以增强文本内容的呈现。
- 通过在数学符号内使用文本格式化命令,LaTeX 允许将样式化的文本元素集成到数学表达式中,从而有助于提高数学内容的清晰度和视觉吸引力。
下标和上标
在 LaTeX 中,下标和上标用于将文本或符号放置在数学表达式的基线下方(下标)或上方(上标)。它们通常用于表示数学符号中的索引、指数或特殊注释。
下标
要在 LaTeX 中创建下标,我们可以使用下划线 `_`。
上标
要在 LaTeX 中创建上标,我们可以使用插入符号 `^`。
绘图注释中的下标和上标用法
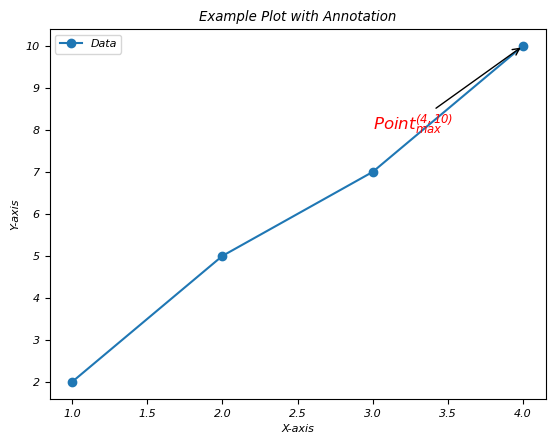
在此示例中,我们通过使用 LaTeX 在绘图的注释中使用下标和上标用法。
示例
import matplotlib.pyplot as plt
# Generating some data points
x = [1, 2, 3, 4]
y = [2, 5, 7, 10]
plt.plot(x, y, 'o-', label='Data')
# Annotating a point with a subscript and a superscript
plt.annotate(r'$\mathrm{Point}_{\mathrm{max}}^{(4, 10)}$',
   xy=(x[y.index(max(y))], max(y)),
   xytext=(3, 8),
   arrowprops=dict(facecolor='black', arrowstyle='->'),
   fontsize=12,
   color='red')
plt.xlabel('X-axis')
plt.ylabel('Y-axis')
plt.title('Example Plot with Annotation')
plt.legend()
plt.show()
输出
执行上述代码后,您将获得以下输出:
需要记住的重要事项
- 下标和上标可以在 LaTeX 数学符号中独立或组合使用。
- 它们对于表示变量、索引、指数和其他相关数学注释至关重要。
- LaTeX 会根据数学表达式中的上下文和周围元素自动处理下标和上标的位置和大小。
- 通过在 LaTeX 中使用下标和上标,我们可以精确地表达数学公式和符号,从而提高数学内容的清晰度和可读性。
组合文本和数学
在使用 LaTeX 进行注释时,组合文本和数学涉及以连贯且视觉上有效的方式在注释中嵌入常规文本和数学表达式。
在绘图上使用 Latex 组合文本和数学
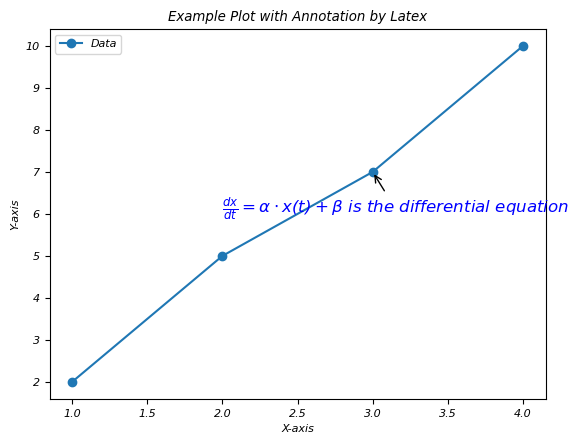
在此示例中,我们通过使用 LaTeX 在注释中组合文本和数学。
示例
import matplotlib.pyplot as plt
# Generating some data points
x = [1, 2, 3, 4]
y = [2, 5, 7, 10]
plt.plot(x, y, 'o-', label='Data')
# Annotating a point with combined text and math in LaTeX
plt.annotate(r'$\frac{dx}{dt} = \alpha \cdot x(t) + \beta$ is the differential equation',
   xy=(x[2], y[2]),
   xytext=(2, 6),
   arrowprops=dict(facecolor='black', arrowstyle='->'),
   fontsize=12,
   color='blue')
plt.xlabel('X-axis')
plt.ylabel('Y-axis')
plt.title('Example Plot with Annotation by Latex')
plt.legend()
plt.show()
输出
执行上述代码后,您将获得以下输出:
文本颜色和字体样式
在 Matplotlib 中的 LaTeX 注释中,我们可以使用 LaTeX 命令设置文本颜色和字体样式,以增强注释的视觉外观。
文本颜色
要在 LaTeX 注释中设置文本颜色,我们可以使用 LaTeX 颜色命令,例如
\textcolor{color_name}{text}
字体样式
以下是应用于绘图注释的不同字体样式。
粗体文本 - 使用命令 \textbf{} 显示粗体文本。
斜体 - 要以斜体样式显示文本,我们可以使用 \textit{}。
下划线 - 要为文本添加下划线,我们使用 \underline{}。
组合使用文本和字体样式进行注释
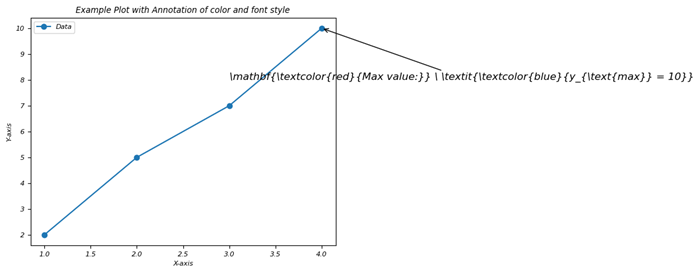
在此示例中,我们使用 LaTeX 更改文本颜色并将定义的样式应用于绘图的注释。
示例
import matplotlib.pyplot as plt
# Generating some data points
x = [1, 2, 3, 4]
y = [2, 5, 7, 10]
plt.plot(x, y, 'o-', label='Data')
# Annotating a point with different text color and font style
plt.annotate(r'\mathbf{\textcolor{red}{Max value:}} \ \textit{\textcolor{blue}{y_{\text{max}} = 10}}',
   xy=(x[y.index(max(y))], max(y)),
   xytext=(3, 8),
   arrowprops=dict(facecolor='black', arrowstyle='->'),
   fontsize=12)
plt.xlabel('X-axis')
plt.ylabel('Y-axis')
plt.title('Example Plot with Annotation of color and font style')
plt.legend()
plt.show()
输出
执行上述代码后,您将获得以下输出:
需要特别注意的重要事项
- 通过在字符串之前使用 `r` 前缀,确保在 Matplotlib 注释中正确解释 LaTeX。
- 根据我们的可视化需求调整颜色、字体样式和其他格式参数。
- 通过利用Matplotlib注释中LaTeX命令的文本颜色和字体样式,我们可以创建视觉上吸引人且信息丰富的图例注释。调整这些属性有助于突出显示重要信息并改善可视化的整体美观性。
最后,我们可以说通过在Matplotlib的注释中使用LaTeX,我们可以通过允许更清晰和更具信息量的可视化来丰富我们的图形和图表,其中包含格式化的文本、数学符号和样式化的标签。
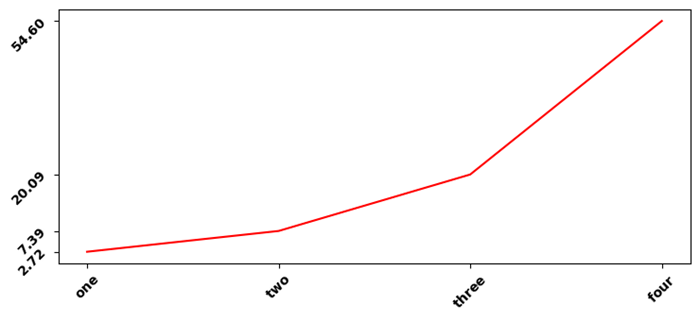
LaTeX坐标轴标签的粗体字重
在这个示例中,我们将LaTex坐标轴标签设置为粗体字重。
示例
import numpy as np
from matplotlib import pyplot as plt, font_manager as fm
plt.rcParams["figure.figsize"] = [7.50, 3.50]
plt.rcParams["figure.autolayout"] = True
plt.rcParams["font.fantasy"] = "Comic Sans MS"
x = np.array([1, 2, 3, 4])
y = np.exp(x)
ax1 = plt.subplot()
ax1.set_xticks(x)
ax1.set_yticks(y)
ax1.plot(x, y, c="red")
ax1.set_xticklabels([r"$\bf{one}$", r"$\bf{two}$", r"$\bf{three}$",
   r"$\bf{four}$"], rotation=45)
ax1.set_yticklabels([r"$\bf{:.2f}$".format(y[0]), r"$\bf{:.2f}$".format(y[1]),
   r"$\bf{:.2f}$".format(y[2]), r"$\bf{:.2f}$".format(y[3])], rotation=45)
plt.tight_layout()
plt.show()
输出
执行上述代码后,您将获得以下输出:
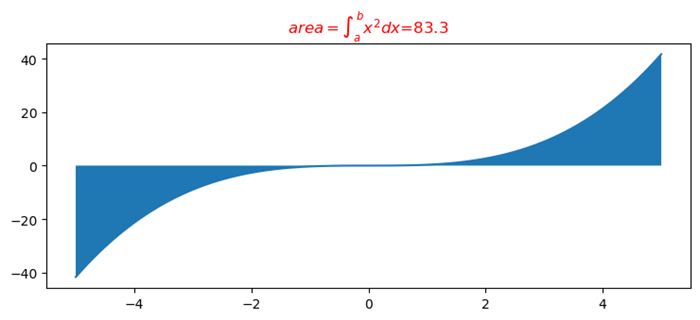
使用matplotlib的LaTeX格式化程序格式化浮点数
在此示例中,我们使用matplotlib的Latex格式化程序格式化浮点数。
示例
import numpy as np
from matplotlib import pyplot as plt
# Set the figures size
plt.rcParams["figure.figsize"] = [7.50, 3.50]
plt.rcParams["figure.autolayout"] = True
# x and y data points
x = np.linspace(-5, 5, 100)
y = x**3/3
# Plot the data points
plt.plot(x, y)
# Fill the area between the curve
plt.fill_between(x, y)
# LaTex representation
plt.title("$area=\int_a^b{x^2dx}$=83.3")
# Display the plot
plt.show()
输出
执行上述代码后,您将获得以下输出:
在Matplotlib输出中获得与LaTex输出相同的字体
在此示例中,我们使用matplotlib的Latex格式化程序格式化浮点数。
示例
import numpy as np
from matplotlib import pyplot as plt
# Set the figures size
plt.rcParams["figure.figsize"] = [7.50, 3.50]
plt.rcParams["figure.autolayout"] = True
# x and y data points
x = np.linspace(-5, 5, 100)
y = x**3/3
# Plot the data points
plt.plot(x, y)
# Fill the area between the curve
plt.fill_between(x, y)
# LaTex representation
plt.title("$area=\int_a^b{x^2dx}$=83.3")
# Display the plot
plt.show()
输出
执行上述代码后,您将获得以下输出:
